Figure 2
Environmental influence on blood serum detection using ultraviolet 365
Kelly P Kearse*
Published: 26 March, 2021 | Volume 5 - Issue 1 | Pages: 030-036
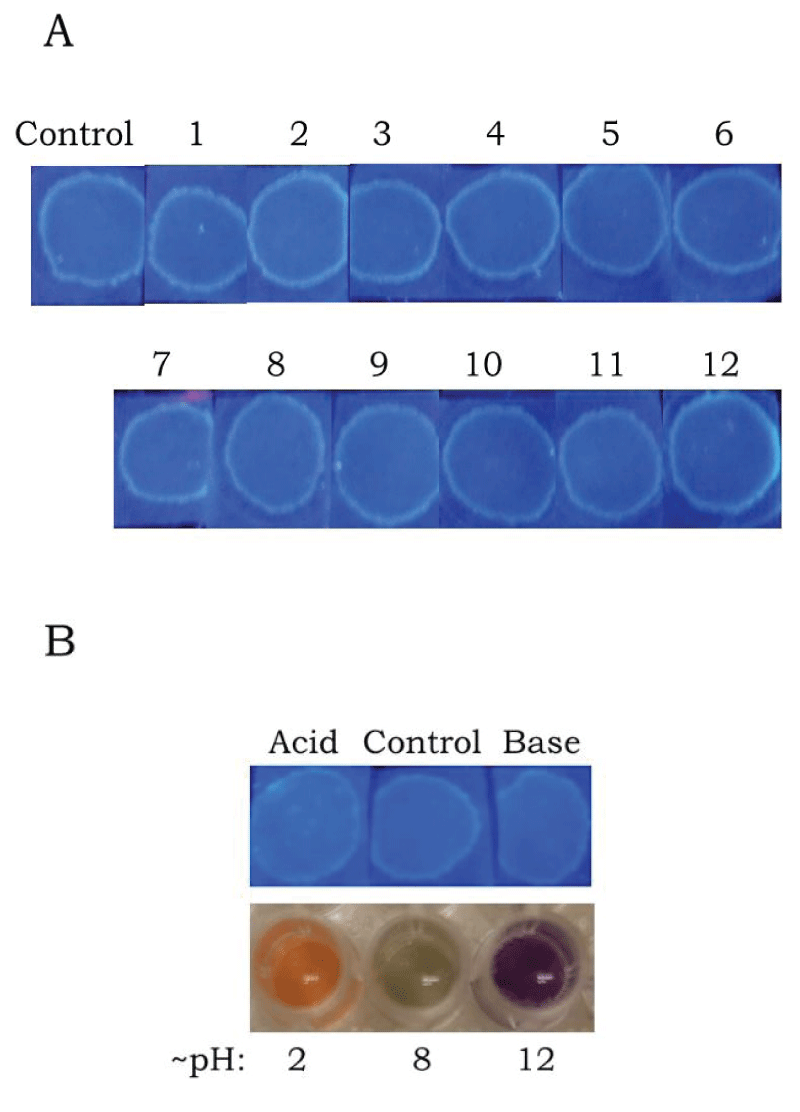
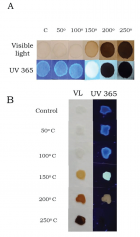
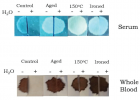
Figure 2:
Effect of pH on serum appearance. (A). Serum was added to filter paper that had been soaked in solutions with the approximate pH as indicated. Samples were evaluated under UV 365 (system 1). (B). Top row: Acid, base, or distilled water (control) was mixed with serum and then transferred to filter paper. Samples were evaluated under UV 365 (system 1). Bottom row: An aliquot of each mixture was added to universal indicator to verify pH (see Materials and Methods for details).
Read Full Article HTML DOI: 10.29328/journal.jfsr.1001024 Cite this Article Read Full Article PDF
More Images
Similar Articles
-
Environmental influence on blood serum detection using ultraviolet 365Kelly P Kearse*. Environmental influence on blood serum detection using ultraviolet 365. . 2021 doi: 10.29328/journal.jfsr.1001024; 5: 030-036
-
Ultraviolet fluorescent detection of elevated bilirubin in dried blood serumKelly P Kearse*. Ultraviolet fluorescent detection of elevated bilirubin in dried blood serum. . 2022 doi: 10.29328/journal.jfsr.1001036; 6: 049-052
-
The Effect of Humidity on Blood Serum Pattern Formation and Blood TransferKelly P Kearse*. The Effect of Humidity on Blood Serum Pattern Formation and Blood Transfer. . 2023 doi: 10.29328/journal.jfsr.1001048; 7: 040-048.
Recently Viewed
-
Epidemiological Prevalence of Tuberculosis in the State of Maranhão between 2014 and 2016Pedro Agnel Dias Miranda Neto*,Hortência Biatriz de Melo Santana, Vanessa Maria das Neves,Hermerson Sousa Maia,Thayná Milena Nunes França,Rosana Karla Costa. Epidemiological Prevalence of Tuberculosis in the State of Maranhão between 2014 and 2016. J Pulmonol Respir Res. 2019: doi: 10.29328/journal.jprr.1001012; 3: 013-016
-
Impact of Refractive Error Correction on Vision Related Quality of Life in School-Aged Children-A Prospective Interventional StudyAshok Rathi*,Sonam Gill,RS Chauhan,Jyoti Deswal,Abhishek Sagar,Nipun Rathi. Impact of Refractive Error Correction on Vision Related Quality of Life in School-Aged Children-A Prospective Interventional Study. Int J Clin Exp Ophthalmol. 2025: doi: 10.29328/journal.ijceo.1001061; 9: 011-017
-
Case report: contrast imaging in the setting of venous thrombosisDaniel Stephen Green*,Daniel O’Neill,Marion Dimigen,Simren Kaur,Roy Beran. Case report: contrast imaging in the setting of venous thrombosis. J Neurosci Neurol Disord. 2023: doi: 10.29328/journal.jnnd.1001072; 7: 001-004
-
Case study (A and B): a patient with Parkinson’s diseaseMuhammad Zulkifl Hasan*,Muhammad Zunnurain Hussain,Khadeeja Anjum,Arha Anwar. Case study (A and B): a patient with Parkinson’s disease. J Neurosci Neurol Disord. 2023: doi: 10.29328/journal.jnnd.1001073; 7: 005-010
-
Mercury toxicity and amyotrophic lateral sclerosisCarmine Ungaro*,Teresa Sprovieri#. Mercury toxicity and amyotrophic lateral sclerosis. J Neurosci Neurol Disord. 2023: doi: 10.29328/journal.jnnd.1001074; 7: 011-013
Most Viewed
-
Feasibility study of magnetic sensing for detecting single-neuron action potentialsDenis Tonini,Kai Wu,Renata Saha,Jian-Ping Wang*. Feasibility study of magnetic sensing for detecting single-neuron action potentials. Ann Biomed Sci Eng. 2022 doi: 10.29328/journal.abse.1001018; 6: 019-029
-
Evaluation of In vitro and Ex vivo Models for Studying the Effectiveness of Vaginal Drug Systems in Controlling Microbe Infections: A Systematic ReviewMohammad Hossein Karami*, Majid Abdouss*, Mandana Karami. Evaluation of In vitro and Ex vivo Models for Studying the Effectiveness of Vaginal Drug Systems in Controlling Microbe Infections: A Systematic Review. Clin J Obstet Gynecol. 2023 doi: 10.29328/journal.cjog.1001151; 6: 201-215
-
Prospective Coronavirus Liver Effects: Available KnowledgeAvishek Mandal*. Prospective Coronavirus Liver Effects: Available Knowledge. Ann Clin Gastroenterol Hepatol. 2023 doi: 10.29328/journal.acgh.1001039; 7: 001-010
-
Causal Link between Human Blood Metabolites and Asthma: An Investigation Using Mendelian RandomizationYong-Qing Zhu, Xiao-Yan Meng, Jing-Hua Yang*. Causal Link between Human Blood Metabolites and Asthma: An Investigation Using Mendelian Randomization. Arch Asthma Allergy Immunol. 2023 doi: 10.29328/journal.aaai.1001032; 7: 012-022
-
An algorithm to safely manage oral food challenge in an office-based setting for children with multiple food allergiesNathalie Cottel,Aïcha Dieme,Véronique Orcel,Yannick Chantran,Mélisande Bourgoin-Heck,Jocelyne Just. An algorithm to safely manage oral food challenge in an office-based setting for children with multiple food allergies. Arch Asthma Allergy Immunol. 2021 doi: 10.29328/journal.aaai.1001027; 5: 030-037

HSPI: We're glad you're here. Please click "create a new Query" if you are a new visitor to our website and need further information from us.
If you are already a member of our network and need to keep track of any developments regarding a question you have already submitted, click "take me to my Query."


