
More Information
Submitted: February 03, 2026 | Accepted: February 12, 2026 | Published: February 13, 2026
Citation: Bakmeedeniya AHMTC, Wimalasena GGM, Peramune PADL, Wijayawickrama JPTR, Panapitiya PHP, Malalasekara PP, et al. Temporal Pattern Mining in Illicit Drug Seizures: A Comparative Analysis of Heroin and Methamphetamine. J Forensic Sci Res. 2026; 10(1): 001-008. Available from:
https://dx.doi.org/10.29328/journal.jfsr.1001109
DOI: 10.29328/journal.jfsr.1001109
Copyright license: © 2026 Bakmeedeniya AHMTC, et al. This is an open access article distributed under the Creative Commons Attribution License, which permits unrestricted use, distribution, and reproduction in any medium, provided the original work is properly cited.
Keywords: Anomaly detection; Change-point analysis; Data-driven policy; Time-series analysis; Weight-category transitions; Sri Lanka

Temporal Pattern Mining in Illicit Drug Seizures: A Comparative Analysis of Heroin and Methamphetamine
AHMTC Bakmeedeniya1, GGM Wimalasena2*, PADL Peramune2, JPTR Wijayawickrama2, PHP Panapitiya2, PP Malalasekara2, UWS Premathilaka2 and KADC Kodithuwakku2
1NSBM Green University, Homagama, Pitipana, Sri Lanka
2Government Analyst’s Department, Pelawatte, Battaramulla, Sri Lanka
*Corresponding author: GGM Wimalasena, Government Analyst’s Department, Pelawatte, Battaramulla, Sri Lanka, Email: [email protected]
The increasing number and changing trends of heroin and methamphetamine in Sri Lanka are a major problem for the health, law enforcement, and policy-making of the community. These illicit substances have been displaying significant growth and changes through the weight categories over the period between 2015 and 2024, indicating the necessity to intervene and solve the problem in a timely and data-driven manner. The analysis of data on seizures in this study was based on anomaly detection, change-point analysis, modeling of weight-category transition, and yearly clustering to reveal structural changes, trends, and patterns of interaction in drug-related activities. The cases of heroin increased steadily between the year 2015, when the number of cases per month was around 120 cases, and 2024, when the number of cases exceeded 450 cases per month, and the number of cases of methamphetamine increased after 2022 and had over 300 cases per month in 2024. The anomaly identification in June-September 2020 and January 2024 showed that the deviations were substantial, and this meant that the heroin activity was largely interrupted. The change-point analysis revealed the changes in the trends of heroin in 2018-2019 and 2025, but not the changes in methamphetamine, which began to change in 2022. Heroin incident at transitions between weight categories decreased (< 2 g) and increased (2-5 g and 5-10 g), indicating a trend of increasing typical seizure sizes. The annual clustering indicated that 2020 and 2022-2024 will be years of high activity of heroin, and 2024 will be a year of high activity of methamphetamine. This study will help offer a scalable decision-support model to policymakers, forensic labs, and law enforcement agencies by offering an integrated approach to drug activity change monitoring, strategic planning, and resource allocation. The framework also creates a base of predictive systems in the future that will take into account socio-economic, demographic, and real-time surveillance information to improve proactive intervention measures.
Illicit drug activities pose an important threat to public wellness, group stability, and rule enforcement efficacy worldwide, including Sri Lanka [1]. The island nation has faced rising concerns over the proliferation of substances such as heroin, cannabis, methamphetamines, and synthetic drugs, particularly among youth and urban populations. According to recent reports by the National Dangerous Drugs Control Board (NDDCB) [2], drug-related offenses and seizures have shown fluctuating but sustained growth over the past decade, highlighting the need for timely and data-driven interventions.
Understanding the patterns, trends, and structural shifts in drug-related incidents is essential for designing targeted interventions and improving resource allocation [3]. Traditionally, analyses of illicit drug case data in Sri Lanka have relied on descriptive statistics, police reports, and periodic surveys, which often fail to capture the temporal dynamics and interaction patterns inherent in the data [4].
Latest advances in computational info mining and temporal analysis techniques provide promising avenues to uncover hidden patterns in large-scale datasets. These approaches enable the identification of structural changes, distributional shifts, and interaction patterns above instant, offering a deeper understanding of illicit drug networks and their evolution. By leveraging this type of method, researchers and policymakers can gain actionable insights to anticipate emerging trends, detect anomalous behaviors, and optimize intervention strategies. This study addresses the following research query.
RQ 1: How can computational data mining and temporal analysis techniques be used to uncover structural changes, distributional shifts, and interaction patterns in Sri Lankan illicit drug seizure data across different weight categories over time?
The primary contribution of this function is a framework that combines temporal pattern mining, network analysis, and statistical modeling to analyze longitudinal illicit drug case data in Sri Lanka. This aims to give an extra comprehensive and dynamic understanding of drug-related activities than classic static analyses.
Heroin remains among the high-risk and widely misused illegal substances across the globe. The reports of the United Nations Workplace on Drugs and Crime indicate that, even after decades of handling actions [5], heroin is still a significant cause of deaths concerning drugs, infectious diseases, and group injuries [6,7]. Heroin is an addictive substance, connected to organized crime, and with associated health problems, which has made the drug a continual problem in governments and wellness systems worldwide, with 236 tons seized in 2024, a 24 percent increase over the year before, stemming in part from high-volume production and trafficking by well-funded transnational criminal networks in Myanmar's Shan Say region of the country [8].
Sri Lanka is not exempted of this trend in the world. Heroin became a widely abused drug in the nation in the last ten years, with an increasing number of people getting admitted to rehab centers. Its consequences are not limited to the health of individuals, as they lead to crime, unemployment, and instability in the family, and overall problems of society. The Government Analyst Department (GAD), the agency that tests heroin cases, has been faced with mounting pressure in the face of the increasing number of cases, thus leading to delays in laboratory testing and reporting of cases [2]. These issues clearly show that there is an urgent need to have data-driven strategies to monitor, manage, and predict the trends of drugs. Study of seizure data and other related cases will help forensic laboratories recognize new substances and patterns of use, which can be used by the policy maker to act in time and respond with specific prevention strategies [9]. The application of forecasting and computational modeling in drug research has been identified as an appealing method in recent years, with the provision of powerful tools in evidence-based policy making.
The classical instant series models have been applied in capturing both linear trends and seasonality in drug-related data in the form of Autoregressive Integrated Moving Average (ARIMA) and Seasonal Autoregressive Integrated Moving Average (SARIMA) models [10]. However, such models are often faced with non-linear dynamics and sudden changes that define illicit drug information in the real world [11]. Machine learning and deep learning approaches have been added to overcome these limitations. Long-lasting Short-Memory (LSTM) networks and another model of recurrent neural networks are especially handy in capturing time dependencies [12]. And the long-term patterns, which are crucial in the case of modeling the drug situation trends due to group, financial, and enforcement-related factors. Classical statistical models combined with deep learning have demonstrated better predictive ability [13], which is the reason why hybrid methods might be used to predict cases involving heroin and help allocate resources proactively and preventatively [14]. Although there is an increasing international investigation, there are no such studies in Sri Lanka where computational info mining and predictive modeling have been used to understand and predict the trends associated with drugs. Most of the current research focuses on descriptive research of substance use or rehabilitation outcomes. At this point, the gap shows the need for data-driven approaches that are not limited to description because they allow identifying patterns, trends, and structural changes in drug-related activities. These understandings can be used by law enforcement, the community health officials of the day, and policymakers to implement timely measures and make evidence-based choices.
This research paper seeks to examine how computational data mining and time series analysis methods can be used on the data of illicit drug cases to show the structural alterations, changing patterns, distributional shifts, and the dynamics of interactions over time. It is not only limited to making predictions, but it also emphasizes the workings and interrelationships that define drug-related activities in Sri Lanka. The rest of the paper is structured in the following way the Methodology section outlines the dataset, its descriptive statistics, and the data mining processes that were conducted; the Results section contains the main findings, the patterns, and trends observed in the data; and the Conclusion section is the summary of the findings, its implications on policy and enforcement, and what directions the research can take in the future.
This study analyses multi–year drug seizure records for heroin and methamphetamine, categorized by weight classes and reported monthly. The objective is to uncover temporal patterns, detect anomalies, compare cross-drug dynamics, and develop early-warning indicators for high-risk periods.
Data collection and preprocessing
Heroin and methamphetamine drug cases datasets were obtained from the Government Analyst Department, Sri Lanka. The total amount of drug cases reported was categorized into several weight groups, including < 2 g, 2–5 g, 5–10 g, 10–200 g, >200 g, and cases without reported weight. These records cover a period of roughly ten years, from 2015 to 2019. A Date variable was generated using Year and Month to ensure proper chronological ordering. This preprocessing step ensured proper temporal alignment.
Descriptive and correlation analysis
Descriptive analysis was first conducted to summarize the key characteristics of heroin and methamphetamine seizure data across the full study period. Monthly total drug cases and weight-category distributions were examined to understand the overall scale and variability of drug seizures. Time-based plots were generated to illustrate long-term patterns and highlight periods of unusually high or low seizure volumes. This provides an overview of how trafficking activity evolved and established a foundation for more advanced analytical techniques. Correlation analysis was performed to explore the relationship between heroin and methamphetamine seizures across months and weight categories. Pearson correlation coefficients were calculated to determine whether increases or decreases in one drug's cases were associated with similar changes in the other. A correlation heatmap was used to visualize these relationships. This analysis helped assess whether the two drugs followed similar temporal patterns or operated independently within the observed period.
Anomaly detection
To discover sudden changes in the seizure activity, which might reflect enforcement action or transportation disturbance, an anomaly detector was chosen to detect the abrupt change in the temporal drug seizure data. Anomalies in monthly drug seizure cases were identified using a combination of statistical and machine learning approaches. A simple 2σ statistical method was first applied to the total number of cases, flagging months where the counts deviated significantly from the mean.
The Z-score of observation Xi is defined as:
where µ is the mean of the time series, and σ is the standard deviation. A point is considered an anomaly if:
Isolation Forest and Local Outlier Factor (LOF) were also applied to capture more complex patterns across different weight categories. Isolation Forest flags data points that are significantly different from the rest of the data, while LOF identifies cases that occur in unusual neighborhoods compared to surrounding points.
Isolation Forest detects anomalies by isolating points in the feature space using random partitioning. The anomaly score for a point xi is:
Where E(h(xi)) is the expected path length of xi in a random tree, and c(n) is the average path length of unsuccessful searches in a binary search tree of size n. Points with s(xi, n) ≈ 1 are considered highly anomalous, while those with s(xi, n) ≈ 0.5 are considered normal.
The anomalies identified by each method are illustrated through time-series plots, making it easier to spot unusual trends over time. Consensus analysis was employed to improve the robustness of anomaly detection by integrating the outputs of multiple detection techniques. Since individual anomaly detection methods rely on different assumptions and sensitivities, agreement across methods provides stronger evidence of true anomalous behavior rather than method-specific artifacts. For each time t, anomaly labels obtained from the π-based statistical test, Isolation Forest, and Local Outlier Factor were combined. A consensus score was computed as the number of methods that identified the same time as anomalous:
where Πm(t) = 1 if method m flags time t as anomalous, and 0 otherwise.
Based on the consensus score, anomalies were categorized as follows:
- Strong consensus anomaly: Detected by all three methods (Ct = 3).
- Moderate consensus anomaly: Detected by any two methods (Ct = 2).
- Weak anomaly: Detected by only one method (Ct = 1).
Only strong and moderate consensus anomalies were emphasized in the interpretation to reduce false positives.
Change point detection
Change-point analysis is especially appropriate to discover structural discontinuities in longitudinal seizure data, and allows one to discover discontinuities that could reflect policy, enforcement intensity, or the development of trafficking. The Pelt method is used to detect the change point. This is used to identify structural breaks in the time series where statistical properties change abruptly. The changes detected here can indicate significant shifts in trafficking behavior due to various reasons, such as alterations in drug routes, variations in enforcement intensity, market disruptions, or the introduction of new smuggling techniques.
Weight-category transition modeling
Weight-category transition modeling was performed to investigate how seizures evolve across different quantity categories over time. By examining transitions from small quantities (e.g., <2 g) to larger quantities (e.g., >200 g), it is possible to understand whether trafficking operations are scaling up, diversifying, or shifting focus. Visualizations such as stacked area plots allow researchers to track the proportional changes in each weight category over time, revealing structural patterns in the supply chain and operational strategies of traffickers.
where Xc,t is the number of seizures in category c at time t.
Drug substitution dynamics
To assess potential substitution effects between methamphetamine and heroin, correlation analysis was performed on monthly seizure counts, including rolling correlations over 12-month windows. This analysis identifies whether increases in one drug’s seizures coincide with decreases in the other, which can indicate substitution behavior among suppliers or shifts in market demand. The resulting insights provide a deeper understanding of interactions between different drug markets and the dynamics of supply and enforcement pressure over time.
The rolling correlation over a window of size w is:
Clustering temporal patterns
Clustering techniques were employed to group months or years with similar seizure patterns. This makes it possible to introduce groups of years with a similar profile of activities and identify high-activity periods and structural similarity patterns of drug incidents. Yearly drug case data were first aggregated by summing the total number of recorded cases for each calendar year. To ensure comparability across years and to stabilize distance-based clustering, the yearly totals were standardized using z-score normalization. K-means clustering with k=3 was then applied to the standardized yearly counts, grouping years with similar magnitudes of drug cases based on Euclidean distance. The number of clusters was set to k = 3 to reflect meaningful activity phases in the seizure data: low, moderate, and high intensity periods. The resulting clusters were subsequently interpreted as distinct prevalence regimes, representing "low", "transition", and "surge" periods. This clustering approach provides an intuitive, magnitude-based segmentation of long-term trends, enabling the identification of structural changes in yearly drug case patterns without imposing any temporal or causal assumptions.
Where Sk is the set of points in cluster k, and µk is its centroid.
Descriptive and correlation analysis
As shown in Figure 1, there is no strong correlation between methamphetamine and heroin cases overall. However, higher correlations are observed within different weight categories for each drug. Heroin cases in the 2–5 g category show a strong correlation (0.86) with the total number of heroin cases. Similarly, total methamphetamine cases exhibit higher correlations with multiple weight categories, including < 2 g, 2–5 g, 5-10 g, and 10-20 g, indicating that specific seizures contribute more prominently to overall case counts.
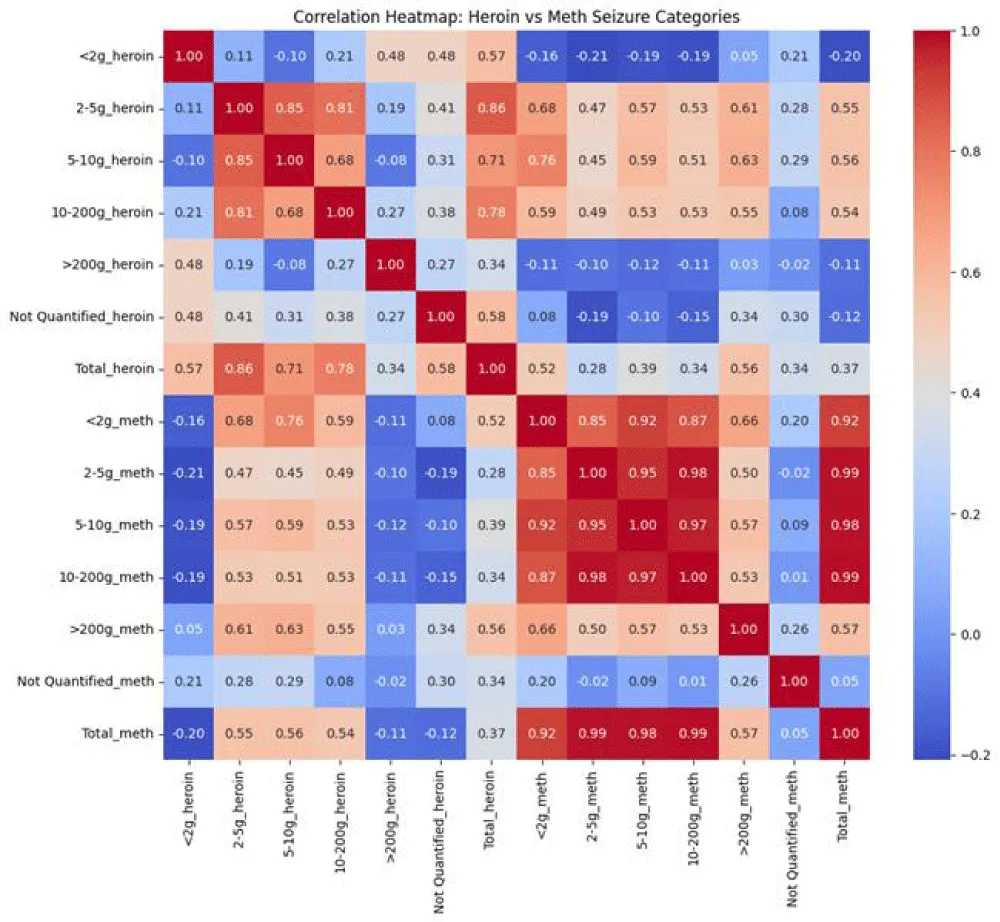
Figure 1: Results of the correlation analysis.
As shown in the line graph in Figure 2, both methamphetamine and heroin cases exhibit an overall increasing trend over the years. Methamphetamine cases appear to start rising notably from 2022 onwards, whereas heroin cases show a continuous increase throughout the period from 2015 to 2024. Further, Figure 3 illustrates the growth of these drugs across different weight categories. After 2020, cases of heroin in the < 2 g category appear to decrease, while the 2–5 g category shows an increasing trend. Methamphetamine exhibits a similar pattern starting from 2022. Notably, methamphetamine cases in the 5–10 g and 10–200 g categories display the steepest increase between 2022 and 2024, representing the most pronounced growth among all weight categories.
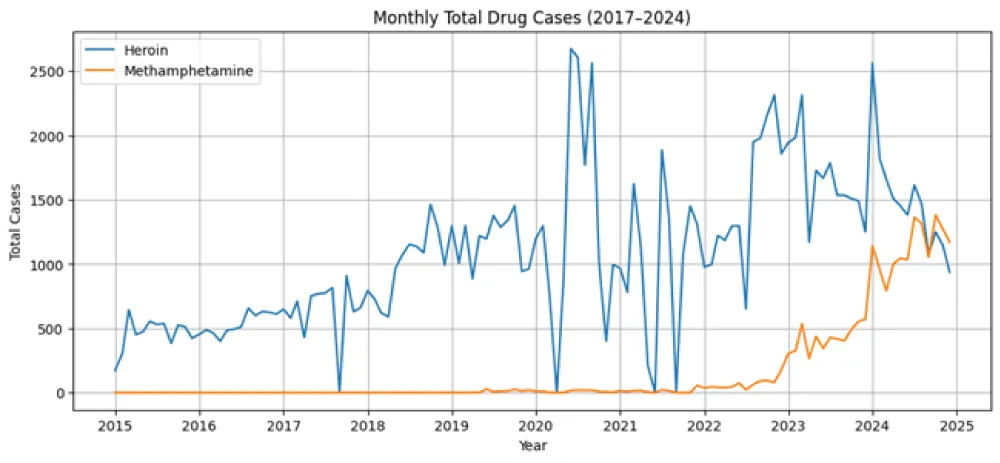
Figure 2: Monthly total drug cases distribution from 2015 to 2025.
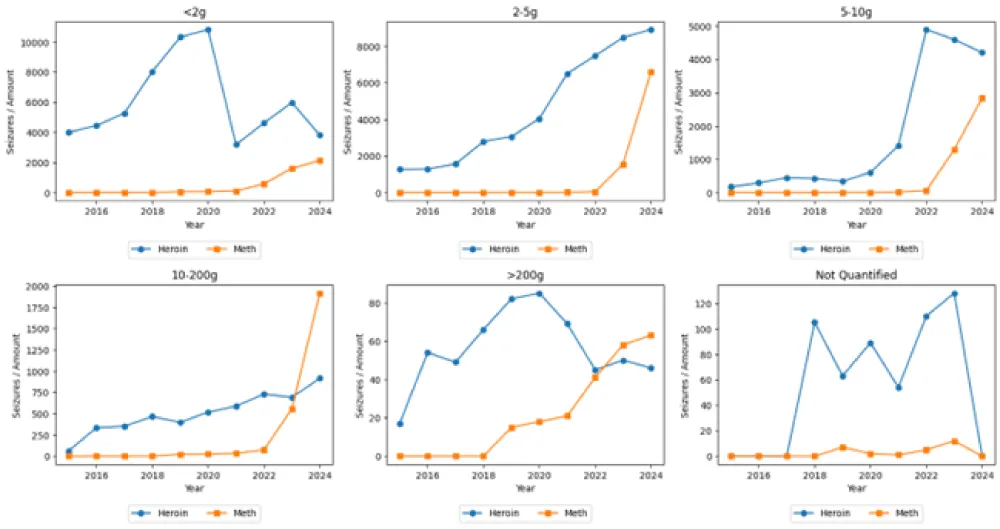
Figure 3: Yearly drug case count for both heroin and methamphetamine.
Anomaly detection
As Table 1 shows, December 2016, February 2018, and several months in 2022. These anomalies indicate localized or short-lived deviations relative to neighboring months rather than major disruptions in the overall pattern. Such weak signals are likely attributable to minor fluctuations or short-term variability and should therefore be interpreted cautiously, as they do not reflect system-wide changes. Months such as September and November 2018, August 2020, July 2021, and late 2022 fall into the moderate category. The concurrence of structural and local-density-based detectors suggests meaningful deviations in the underlying data distribution, even when the deviation is not extreme enough to be captured by simple statistical thresholds. These months may represent transitional phases or emerging changes in heroin-related activity patterns (Figure 4).
| Table 1: Consensus based monthly anomaly detection results for Heroin. | |||||
| Year / Month | 2σ | Isolation Forest | LOF | Cₜ | Level |
| 2016/12 | 0 | 0 | 1 | 1 | Weak |
| 2018/02 | 0 | 0 | 1 | 1 | Weak |
| 2018/09 | 0 | 1 | 1 | 2 | Moderate |
| 2018/11 | 0 | 1 | 1 | 2 | Moderate |
| 2019/09 | 0 | 0 | 1 | 1 | Weak |
| 2020/06 | 1 | 1 | 1 | 3 | Strong |
| 2020/07 | 1 | 1 | 1 | 3 | Strong |
| 2020/08 | 0 | 1 | 1 | 2 | Moderate |
| 2020/09 | 1 | 1 | 1 | 3 | Strong |
| 2021/07 | 0 | 1 | 1 | 2 | Moderate |
| 2022/07 | 0 | 0 | 1 | 1 | Weak |
| 2022/08 | 0 | 1 | 0 | 1 | Weak |
| 2022/09 | 0 | 1 | 0 | 1 | Weak |
| 2022/11 | 1 | 1 | 0 | 2 | Moderate |
| 2023/03 | 1 | 1 | 0 | 2 | Moderate |
| 2024/01 | 1 | 1 | 1 | 3 | Strong |
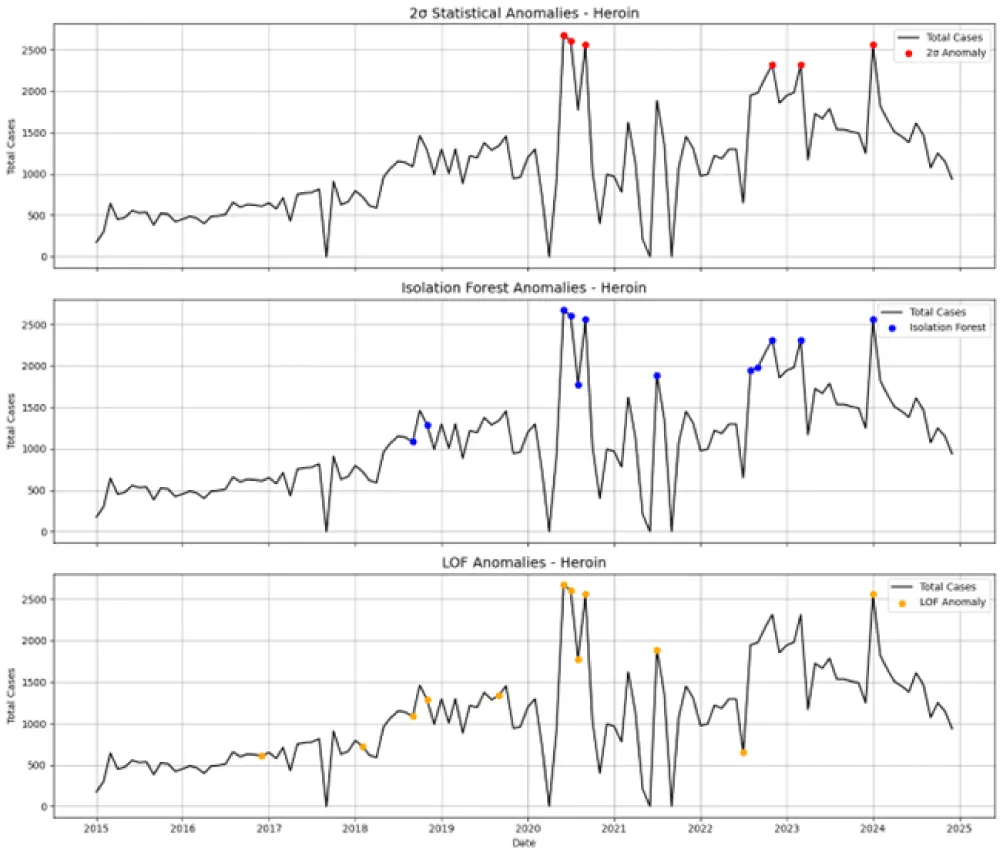
Figure 4: Results of the Anomaly detection of Heroin cases.
Strong category occurs notably in June, July, and September 2020, as well as January 2024. The agreement across statistical, structural, and local perspectives implies that these months correspond to substantial disruptions rather than noise or isolated fluctuations. Such strong anomalies are likely associated with external shocks or systemic changes and therefore warrant further investigation (Figure 5).
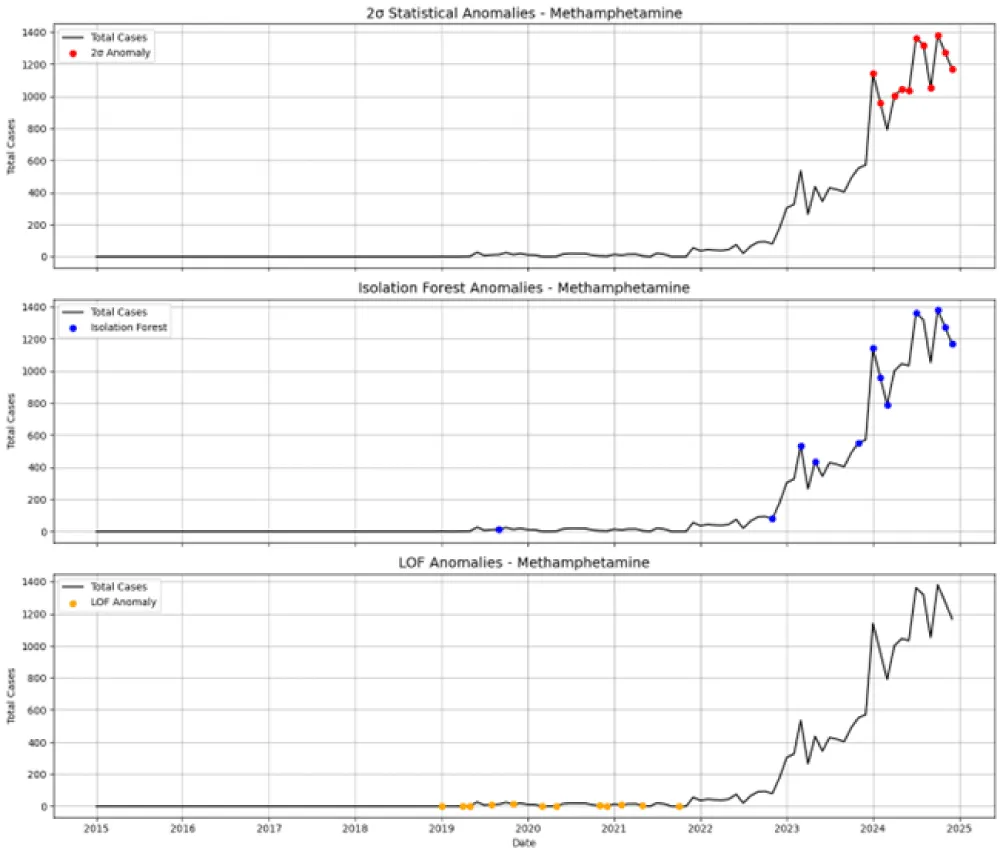
Figure 5: Results of the Anomaly detection of Methamphetamine.
Most months between 2019 and 2023 are classified as weak anomalies, as shown in Table 2. This pattern suggests that many anomalies during this period arise from local density changes relative to neighboring months, rather than global statistical deviations or major structural shifts. Occasional weak detections by Isolation Forest, particularly in late 2019, 2022, and 2023, further indicate subtle distributional changes that are not sufficiently pronounced to exceed the 2ϭ threshold. Collectively, these weak anomalies reflect short-term variability or localized fluctuations in the underlying data.
| Table 2: consensus-based monthly anomaly detection results of Methamphetamine. | |||||
| Year / Month | 2σ | Isolation Forest | LOF | Cₜ | Level |
| 2019/01 | 0 | 0 | 1 | 1 | Weak |
| 2019/04 | 0 | 0 | 1 | 1 | Weak |
| 2019/05 | 0 | 0 | 1 | 1 | Weak |
| 2019/08 | 0 | 0 | 1 | 1 | Weak |
| 2019/09 | 0 | 1 | 0 | 1 | Weak |
| 2019/11 | 0 | 0 | 1 | 1 | Weak |
| 2020/03 | 0 | 0 | 1 | 1 | Weak |
| 2020/05 | 0 | 0 | 1 | 1 | Weak |
| 2020/11 | 0 | 0 | 1 | 1 | Weak |
| 2020/12 | 0 | 0 | 1 | 1 | Weak |
| 2021/02 | 0 | 0 | 1 | 1 | Weak |
| 2021/05 | 0 | 0 | 1 | 1 | Weak |
| 2021/10 | 0 | 0 | 1 | 1 | Weak |
| 2022/11 | 0 | 1 | 0 | 1 | Weak |
| 2023/03 | 0 | 1 | 0 | 1 | Weak |
| 2023/05 | 0 | 1 | 0 | 1 | Weak |
| 2023/11 | 0 | 1 | 0 | 1 | Weak |
| 2024/01 | 1 | 1 | 0 | 2 | Moderate |
| 2024/02 | 1 | 1 | 0 | 2 | Moderate |
| 2024/03 | 0 | 1 | 0 | 1 | Weak |
| 2024/04 | 1 | 0 | 0 | 1 | Weak |
| 2024/05 | 1 | 0 | 0 | 1 | Weak |
| 2024/06 | 1 | 0 | 0 | 1 | Weak |
| 2024/07 | 1 | 1 | 0 | 2 | Moderate |
| 2024/08 | 1 | 0 | 0 | 1 | Weak |
| 2024/09 | 1 | 0 | 0 | 1 | Weak |
| 2024/10 | 1 | 1 | 0 | 2 | Moderate |
| 2024/11 | 1 | 1 | 0 | 2 | Moderate |
| 2024/12 | 1 | 1 | 0 | 2 | Moderate |
In contrast, moderate anomalies emerge exclusively in 2024, specifically in January, February, July, and the final quarter of the year. These months are jointly flagged by the 2ϭ rule and Isolation Forest, indicating that deviations during this period are both statistically significant and structurally meaningful.
The analysis reveals that most anomalies in the present dataset are weak and localized, with limited detector agreement, indicating short-term or minor irregularities rather than systemic disruptions. Moderate anomalies emerge only in the most recent period, suggesting a transition toward more pronounced statistical and structural deviations. In contrast, the heroin/meth strong-anomaly table captures periods of high-confidence, multi-scale disruption with sustained temporal clustering. Together, these results demonstrate that the consensus-based framework effectively differentiates between localized variability and robust, system-level anomalies, providing a nuanced understanding of temporal abnormality patterns.
Change point detection
The change point detection analysis reveals distinct structural transition periods for heroin and methamphetamine, indicating substance-specific temporal dynamics. In the heroin time series in Figure 6, the first detected change point occurs between 2018 and 2019, marking a shift in the underlying statistical behavior of the data. A second change point in the heroin series is detected in 2025, signifying another major structural shift. This late change implies a substantial alteration in the heroin-related dynamics toward the end of the observation period. In contrast, the methamphetamine time series in Figure 7 exhibits a different change point pattern. The first change point appears in 2022, indicating a delayed structural shift compared to heroin. Similar to heroin, a second change point is detected in 2025, pointing to a concurrent late-stage structural transition affecting both substances.
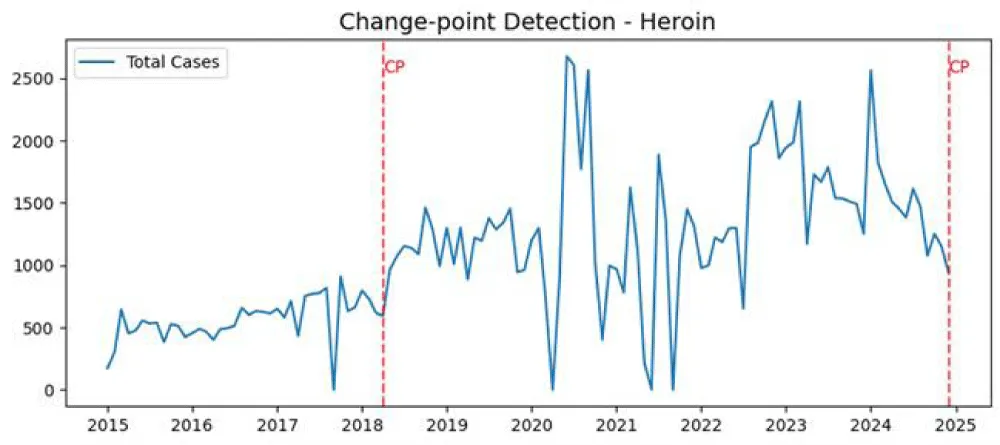
Figure 6: Detected change point of Heroin cases.
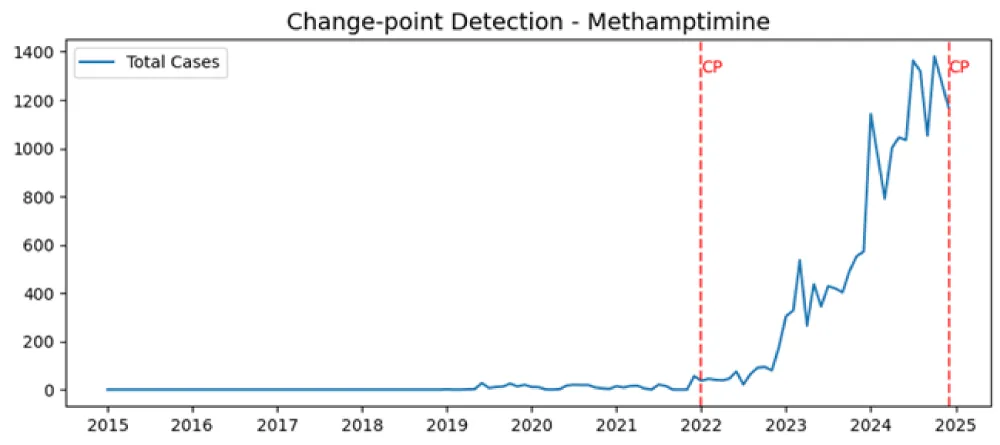
Figure 7: Detected change points of Methamphetamine.
Comparatively, heroin demonstrates earlier structural instability, with regime changes emerging several years before methamphetamine. This temporal asymmetry indicates that heroin dynamics may be more sensitive to earlier systemic influences, while methamphetamine exhibits a lagged response. The shared change point in 2025 suggests a common external or systemic factor influencing both substances simultaneously, reinforcing the interpretation of 2025 as a critical transition period.
Weight-category transition modeling
The weight category transition analysis for heroin reveals a clear post-2021 shift in distribution across weight classes. Specifically, the number of cases in the lowest weight category (< 2 g) declines noticeably after 2021 when compared with higher weight categories. In contrast, the intermediate categories of 2–5 g and 5–10 g exhibit a sustained increase over the same period. This pattern indicates a transition away from low-weight occurrences toward higher-weight events, suggesting an escalation in the typical quantity associated with heroin-related cases rather than a uniform increase across all categories. The increasing prominence of the 2–5 g and 5–10 g categories implies that heroin activity has evolved toward more substantial weight ranges, consistent with the structural changes identified through anomaly and change point analyses. The reduction in the < 2 g category further supports the interpretation that post-2021 dynamics are characterized by fewer low-intensity events and a greater concentration in moderate weight ranges. This redistribution across categories reflects a qualitative change in system behavior rather than simple fluctuation. In contrast, the methamphetamine weight category analysis exhibits a different temporal evolution. After the change point detected in 2022, methamphetamine-related activity increased rapidly, with a pronounced overall rise observed after 2023. Within this growth, the 2–5 g category shows a marked increase during 2024, indicating a surge in moderate-weight cases. Simultaneously, the 5–10 g category also increases, reflecting an expansion into higher weight ranges alongside the overall growth trend (Figures 8,9).
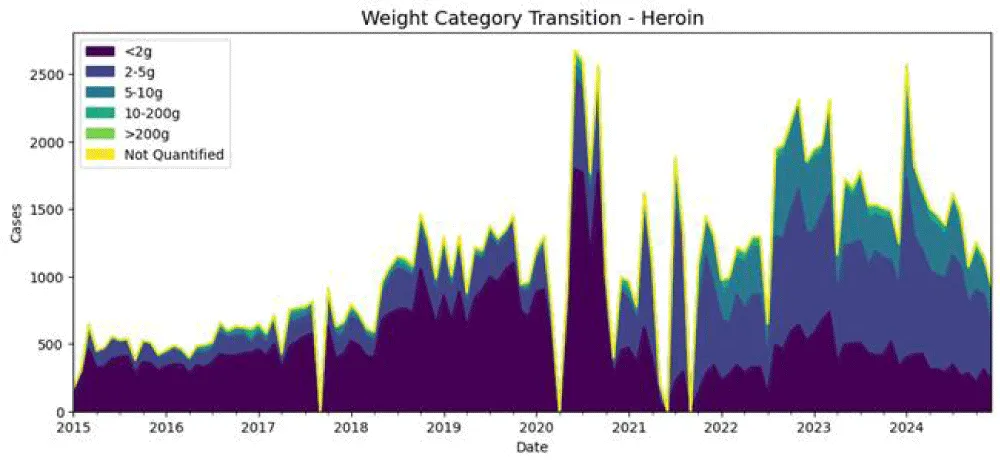
Figure 8: Weight category transition of Heroin.
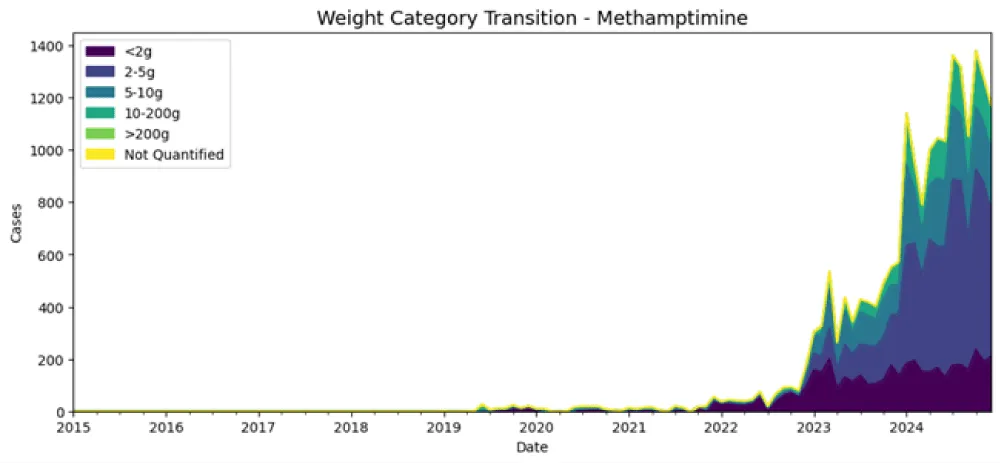
Figure 9: Weight category transition of Methamphetamine.
Yearly clustering
As shown in Figure 10, the final yearly cluster highlights the transition between low and high weight categories. For heroin, the years 2020, 2022, 2023, and 2024 predominantly fall into the high-case cluster compared to other years, indicating elevated activity levels. In contrast, for methamphetamine, as shown in Figure 11, 2024 exhibits a rapid increase into the high-case cluster, whereas the other years are largely characterized by lower cases and transitional activity.
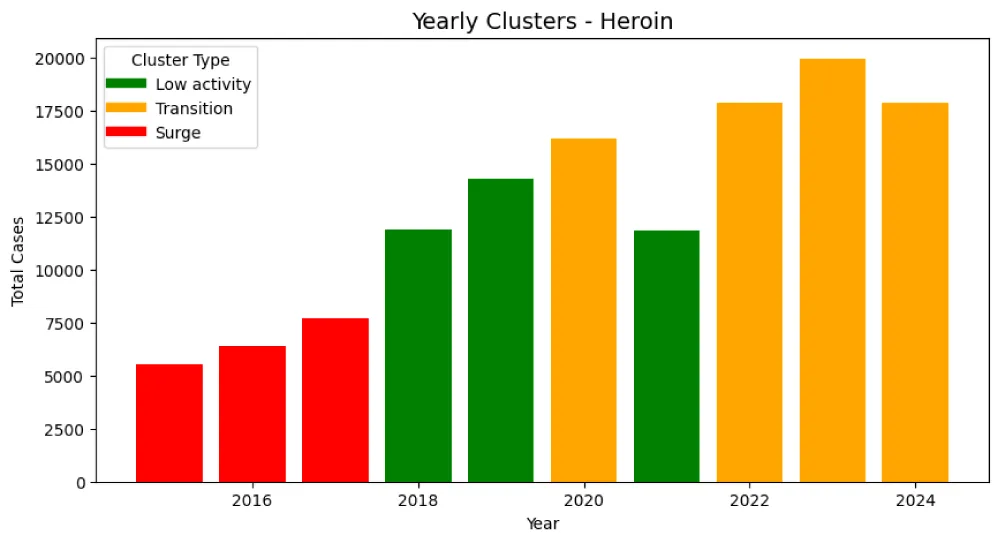
Figure 10: Yearly clusters of Heroin.
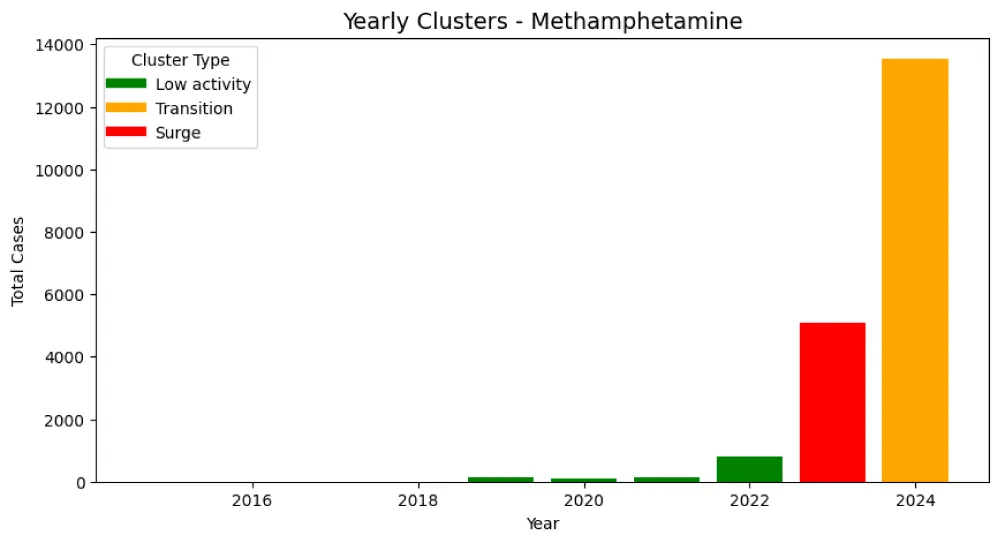
Figure 11: Yearly clusters of Methamphetamine.
The analysis of heroin and methamphetamine activity in Sri Lanka in this paper is a detailed time analysis based on the combination of anomaly detection, change-point analysis, weight-category transitions, and drug substitution patterns. The findings indicate that both substances have substance-specific time dynamics: heroin has earlier fluctuations and gradual redistribution in favor of higher-weight seizures, whereas methamphetamine has delayed and rapid escalation.
The synthesized analytical model provides powerful, interpretable information that can inform specific interventions and strategic planning of policy. Namely, the results indicate that the activity of heroin might imply that early-warning surveillance is essential, whereas the activity of methamphetamine might imply that quick-response interventions are required at the time of intensification. Such trends can be related to changes in the behavior of trafficking, the level of enforcement, or socio-political changes, but no causal relations can be established.
However, this paper is limited in several ways to take into consideration when understanding the results. The analysis is based on a Sri Lanka-specific seizure dataset, which lacks a comparative baseline or cross-country references. Also, the data consists mainly of the incidences of seizures and weight, and no socio-economic, demographic, or geographic variables are included, which could have an impact on the trends in trafficking. It is used in an analytical perspective on descriptive and exploratory time instead of predictive modeling. The future directions of the work should include multi-source and multi-regional data, creation of real-time monitoring and forecasting models, and inclusion of contextual variables to promote predictive performance and policy applicability.
Ethics statement
This research involved the use of anonymized, secondary data, which was collected through the Government Analysts Department, Sri Lanka. No personal identifiable information was accessed or registered. Every analysis was performed within the framework of institutional and national recommendations of ethical use of data, and it was only accessed by appropriate legal mandates of the authorities.
- Palipane J. Sri Lanka has arrested tens of thousands in drug raids, criticized by the UN human rights body. AP News. 2024 Jan. Available from: https://apnews.com/article/sri-lanka-drug-raids-human-rights-4a2c267c246e89fe919335d927f68887
- National Dangerous Drugs Control Board (NDDCB), Sri Lanka. Annual report 2023. Sri Lanka: NDDCB; 2023. Available from: https://www.nddcb.gov.lk/annual-report.php
- Darshana N, Wijesinghe CJ, Silva PVD. Assessment of characteristics and exposure to vulnerable factors for drug use among male illicit drug users in Sri Lanka: a multicenter cross-sectional study. Indian J Community Med. 2022;47(2):285-291. Available from: https://doi.org/10.4103/ijcm.ijcm_712_21
- Jayamaha AR, Dharmarathna ND, Herath NDM, Ranadeva NDK, Fernando MM, Samarasinghe KL, et al. The pattern of substance use and characteristics of the individuals enrolled in residential treatment at selected rehabilitation centers in Sri Lanka: a descriptive cross-sectional study. Subst Abuse. 2022. Available from: https://doi.org/10.1177/11782218221100823
- Harmon J. Forensic laboratories as drug policy partners. Police Chief. 2024 Jan. Available from: https://www.policechiefmagazine.org/forensic-labs-drug-policy-partners/
- Degenhardt L, Whiteford HA, Ferrari AJ, Baxter AJ, Charlson FJ, Hall WD, et al. Global burden of disease attributable to illicit drug use and dependence: findings from the Global Burden of Disease Study 2010. Lancet. 2013;382(9904):1564-1574. Available from: https://doi.org/10.1016/s0140-6736(13)61530-5
- United Nations Office on Drugs and Crime. World drug report 2024. United Nations; 2024. Available from: https://www.unodc.org/unodc/en/data-and-analysis/world-drug-report-2024.html
- World Health Organization. WHO Expert Committee on Drug Dependence: forty-first report. Geneva: World Health Organization; 2019. (WHO Technical Report Series, No. 1018). Available from: https://iris.who.int/server/api/core/bitstreams/d1e75e95-0021-4edd-85da-e5a5c923dd29/content
- Hewamalage H, Ackermann K, Bergmeir C. Forecast evaluation for data scientists: common pitfalls and best practices. Data Min Knowl Discov. 2023;37(2):788-832. Available from: https://link.springer.com/article/10.1007/s10618-022-00894-5
- Bousqaoui H, Slimani I, Achchab S. Comparative analysis of short-term demand predicting models using ARIMA and deep learning. Int J Electr Comput Eng. 2021;11(4):3319. Available from: https://ijece.iaescore.com/index.php/IJECE/article/view/23508
- Li G, Yang N. A hybrid SARIMA-LSTM model for air temperature forecasting. Adv Theory Simul. 2023;6(2). Available from: https://doi.org/10.1002/adts.202200502
- Gers FA, Schmidhuber J, Cummins F. Learning to forget: continual prediction with LSTM. Neural Comput. 2000;12(10):2451-2471. Available from: https://doi.org/10.1162/089976600300015015
- Song X, Deng L, Wang H, Zhang Y, He Y, Cao W. Deep learning-based time series forecasting. Artif Intell Rev. 2024;58(1):23. Available from: https://link.springer.com/article/10.1007/s10462-024-10989-8
- Butt UM, Letchmunan S, Hassan FH, Koh TW. A hybrid of deep learning and exponential smoothing for enhancing crime forecasting accuracy. PLoS One. 2022;17(9):e0274172. Available from: https://doi.org/10.1371/journal.pone.0274172