
More Information
Submitted: February 11, 2026 | Accepted: February 17, 2026 | Published: February 20, 2026
Citation: Sharma R, Matharu R, Sinha R. Socio-demographic and Behavioral Determinants of UPI Fraud Vulnerability: A Descriptive Study from Shimla District, Himachal Pradesh. J Forensic Sci Res. 2026; 10(1): 009-014. Available from:
https://dx.doi.org/10.29328/journal.jfsr.1001110
DOI: 10.29328/journal.jfsr.1001110
Copyright license: © 2026 Sharma R, et al. This is an open access article distributed under the Creative Commons Attribution License, which permits unrestricted use, distribution, and reproduction in any medium, provided the original work is properly cited.
Keywords: UPI; Cyber security; Cyber risk; Victimology; Behavioral economics; Digital payment fraud; User awareness

Socio-demographic and Behavioral Determinants of UPI Fraud Vulnerability: A Descriptive Study from Shimla District, Himachal Pradesh
Reetika Sharma1, Raman Matharu2* and Ritika Sinha3
1Department of Commerce & Management, CDOE, Himachal Pradesh University, Summerhill, Shimla, Himachal Pradesh, 171005, India
2Department of Commerce & Management, St. Bede's College, Navbhar, Shimla, Himachal Pradesh, 171002, India
3Department of Forensic Science, AP Goyal Shimla University, Shimla, Himachal Pradesh, 171013, India
*Corresponding author: Reetika Sharma, Department of Commerce & Management, CDOE, Himachal Pradesh University, Summerhill, Shimla, Himachal Pradesh, 171005, India, Email: [email protected]
The rapid adoption of Unified Payments Interface (UPI) in India has transformed digital financial transactions, offering convenience and speed. However, this growth has exposed users to cybersecurity risks, with certain populations, especially digitally inexperienced or socioeconomically vulnerable individuals, being more susceptible to cyber fraud. Behavioral and cognitive factors, including overconfidence, impulsivity, and susceptibility to social engineering tactics, play a crucial role in shaping victimization patterns. This study aims to examine UPI usage patterns, identify cyber risk factors, and explore the behavioral and demographic determinants of vulnerability. Specific objectives include assessing user awareness of cyber threats, mapping the types of cyber fraud experienced, and evaluating the relationship between behavioral traits, demographic characteristics, and fraud victimization. A cross-sectional survey was conducted in Shimla district, Himachal Pradesh, targeting 183 UPI users across urban and rural communities. Data were collected via structured questionnaires capturing demographics, transaction behavior, cyber fraud experiences, and awareness of preventive measures. Descriptive statistics and cross-tabulations were used to analyze patterns and associations. Findings reveal that young adults (18–25 years) and middle-aged users (41–60 years), lower-educated and lower-income groups, and rural users exhibited higher vulnerability to cyber fraud. Google Pay was the most commonly used platform, with transactions primarily for bill payments and shopping. Phishing, social engineering, and fake QR code scams were the most reported fraud types. Confidence in digital transactions influenced victimization; both overconfident and underconfident users faced higher risks. The study underscores the interplay of cyber risk exposure, behavioral biases, and socio-demographic factors in shaping UPI fraud vulnerability. It highlights the urgent need for digital literacy programs, targeted awareness campaigns, and user centric cyber security interventions to reduce victimization and promote safer digital financial behavior.
The rapid growth of digital financial transactions in India, particularly through the Unified Payments Interface (UPI), has transformed the way individuals conduct peer-to-peer and peer-to-merchant payments. UPI offers speed, convenience, and accessibility, enabling widespread financial inclusion. However, its rapid adoption has also exposed users to increasing cybersecurity risks, with digitally inexperienced or socio-economically vulnerable populations being particularly susceptible. Cyber fraud in UPI transactions has become sophisticated, encompassing phishing, fake payment links, tampered QR codes, identity theft, social engineering, SIM swap attacks, and remote access through malicious applications. Such fraud not only results in financial loss but also erodes trust in digital payment systems and increases operational burdens for financial institutions. At the individual level, low digital literacy, impulsive behavior, overconfidence, and socio-economic constraints amplify vulnerability. Cognitive biases such as confirmation bias, overconfidence, anchoring, and fear of missing out (FOMO) interact with social influences like authority bias and groupthink, further increasing susceptibility to manipulation and fraud. System-level vulnerabilities, including insecure QR codes, excessive app permissions, inadequate authentication, and fake third-party applications, compound the risk, particularly for older adults, rural users, and first-time digital payment adopters. This study adopts a cyber security and behavioural economics perspective, integrating insights from victimology to understand how demographic, socio-economicand behavioral factors shape fraud vulnerability among UPI users. By examining usage patterns, fraud experiences, and user confidence, the research aims to identify the determinants of cyber risk exposure, highlight gaps in awareness, and provide actionable recommendations for enhancing safe digital payment practices. A multi-layered approach combining digital literacy, behavioral interventions, and technological safeguards is essential to protect users and sustain trust in India’s digital financial ecosystem.
The rise of UPI as a digital payment system has introduced not only convenience but also complex vulnerabilities rooted in psychological manipulation and socioeconomic disparities. Fraudsters often exploit cognitive biases such as the scarcity effect and FOMO (fear of missing out) by creating fake urgency, claiming limited-time offers or imminent account suspension, to pressure users into hasty decisions. Emotional manipulation is another tactic, where scammers fabricate emergencies or feign affection to trigger impulsive financial transfers. Reciprocity bias and sympathy exploitation are common in romance and distress scams, while overconfidence bias leads users to underestimate fraud risks, ignoring security protocols and updates. These psychological levers are especially potent in regions with uneven digital literacy and access. The literature highlights that while UPI has significantly advanced financial inclusion and transaction efficiency in India [1-4], its rapid adoption has also led to rising fraud due to design vulnerabilities and small-ticket scams [5,6]. Research shows that UPI fraud vulnerability is strongly influenced by behavioural, sociodemographic, and digital literacy factors with elderly users, rural populations, women, first-time users, and digitally overconfident youth being most at risk [7-12]. However, existing studies largely focus on national trends and victim-based analysis, highlighting a research gap in district-level assessments, such as Shimla, that examine latent vulnerabilities and enable targeted preventive strategies [13-17].
From a forensic science and cyber-victimology perspective, this study aims to better understand why certain individuals are more vulnerable to UPI fraud at the district level. By examining who becomes a victim, how incidents are reported, and what factors increase risk exposure, the research helps build a clearer profile of digital fraud victims.
The study was conducted in Shimla district, Himachal Pradesh, a region known for its administrative, commercial, and educational significance with a diverse population spanning both urban and rural communities. As digital payment adoption, particularly UPI-based transactions, accelerates in Shimla, the district presents an ideal context for examining vulnerabilities to UPI fraud. The research includes both urban zones characterized by dense residential and commercial activity, widespread smartphone usage, and robust internet access, and rural areas where UPI adoption is growing but faces challenges such as limited infrastructure, lower digital literacy, and reduced awareness of cybersecurity threats. This rural-urban distinction enables a comprehensive analysis of user behaviours, risk perceptions, and fraud susceptibility across varied demographic and technological landscapes.
Sample collection
The target population for the study comprised residents of Shimla district who actively use UPI-based digital payment applications such as Google Pay, PhonePe, Paytm, BHIM, and banking UPI apps representing diverse age groups, genders, educational levels, occupations, income categories, and urban and rural backgrounds. The sampling frame included UPI users from varied occupational and demographic segments to capture differences in usage patterns, digital awareness, and exposure to fraud. Stratified random sampling was employed by categorizing respondents into relevant socio-economic and demographic strata and selecting participants randomly within each group to reduce bias and ensure balanced representation. Stratification was based on demographic variables including age group, gender, education level, occupation, income, and rural-urban residence. A total sample size of 183 respondents was selected based on feasibility and to ensure adequate representation across the identified demographic strata. Primary data was collected via a structured Google Form shared with urban and rural residents of Shimla: the self-administered questionnaire captured demographics, UPI usage, fraud experiences, cybersecurity awareness, and perceptions.
Data analysis and interpretation
Responses were compiled using Google Forms built in tools. Descriptive statistics (frequencies and percentages) summarized user profiles and fraud awareness. Cross-tabulations were used to explore the relationships between variables such as age, gender, occupation, and fraud experience. The analysis and interpretation of the primary data collected from 183 respondents across urban and rural areas of Shimla district. The objective is to understand the demographic distribution, UPI usage patterns, experiences of UPI-related frauds, awareness levels, and perceptions of users towards fraud prevention.
The majority of respondents were young adults aged 18–25 years (43.2%), followed by 41–60 years (25.7%) (Table 1; Figure 1), with a nearly equal gender distribution of 51.9% male and 48.1% female (Table 2; Figure 2). Most respondents were graduates (43.7%) or postgraduates (24.6%), indicating higher adoption among the educated population (Table 3; Figure 3). Private sector employees formed the largest occupational group (30.1%), followed by ‘others’ (20.2%), while government employees, students, and homemakers showed moderate participation (Table 4; Figure 4). Income distribution revealed that most users earned below ₹10,000, with significant representation in the ₹10,000–50,000 range, highlighting UPI adoption among lower and middle income groups (Table 5; Figure 5). Geographically, 54.6% were rural and 45.4% urban, reflecting the distribution of the study sample across both residential categories (Table 6; Figure 6). Google Pay was the most preferred app (59%), followed by BHIM UPI (14.2%), PhonePe and Paytm (Table 7; Figure 7). Usage frequency varied: 29.5% used UPI daily, 15.3% 2–3 times per week, 8.2% weekly, and 21.3% rarely (Table 8; Figure 8). Transactions were mainly for bill payments (34.4%) and shopping (30.6%), with mid-value payments of ₹500–2,000 being most common (46.4%) (Tables 9,10; Figures 9,10). Confidence levels were high among 36.6% of respondents, moderate for 27.9%, and low for a smaller segment, indicating the need for awareness and education to enhance safe usage (Table 11; Figure 11).
| Table 1: Age Group Distribution. | ||
| Age | Number of respondents | Percentage |
| 18-25 years | 79 | 43.2% |
| 26-40 years | 34 | 18.6% |
| 41-60 years | 47 | 25.7% |
| Above 60 years | 23 | 12.6% |
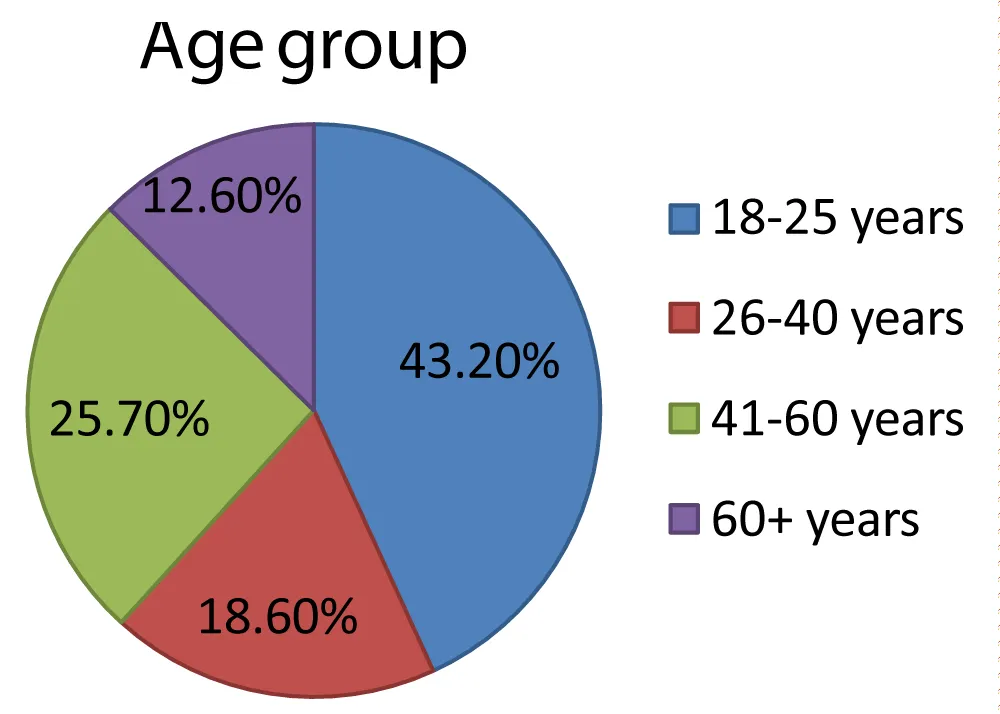
Figure 1: Age Group Distribution.
| Table 2: Gender Distribution. | ||
| Gender | Number of respondents | Percentage |
| Males | 95 | 51.90% |
| Females | 88 | 48.10% |
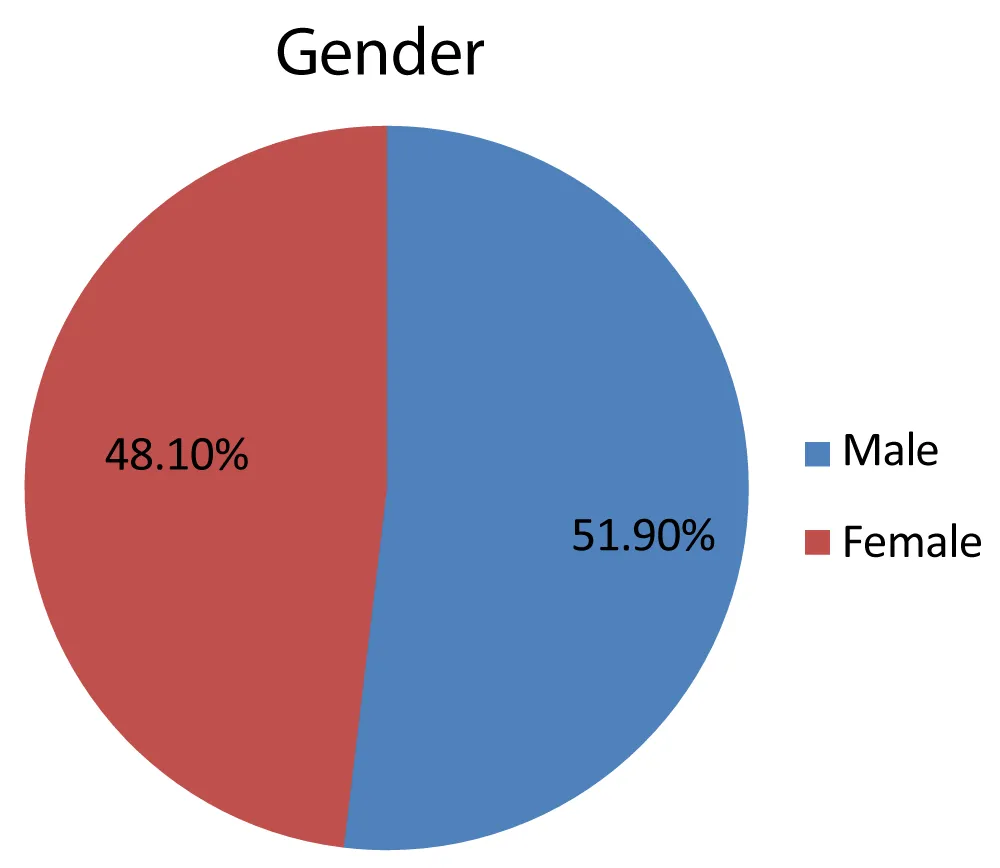
Figure 2: Gender Distribution.
| Table 3: Educational Qualification. | ||
| Educational qualification | Number of respondents | Percentage |
| Below matriculation | 5 | 2.7% |
| Matriculation | 15 | 8.2% |
| Higher secondary | 38 | 20.8% |
| Graduate | 80 | 43.7% |
| Postgraduate | 45 | 24.6% |
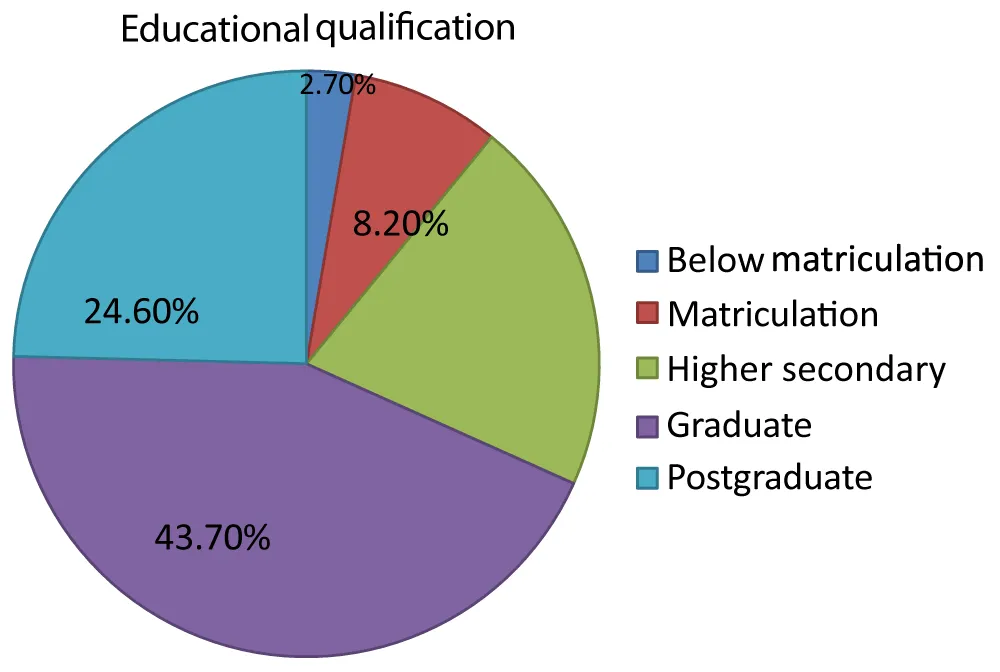
Figure 3: Educational Qualification.
| Table 4: Occupation. | ||
| Occupation | No. of respondents | Percentage |
| Self employed | 10 | 5.5% |
| Government employee | 23 | 12.6% |
| Private sector employee | 55 | 30.1% |
| Homemaker | 22 | 12% |
| Retired individuals | 14 | 7.7% |
| Students | 22 | 12% |
| Others | 37 | 20.2% |
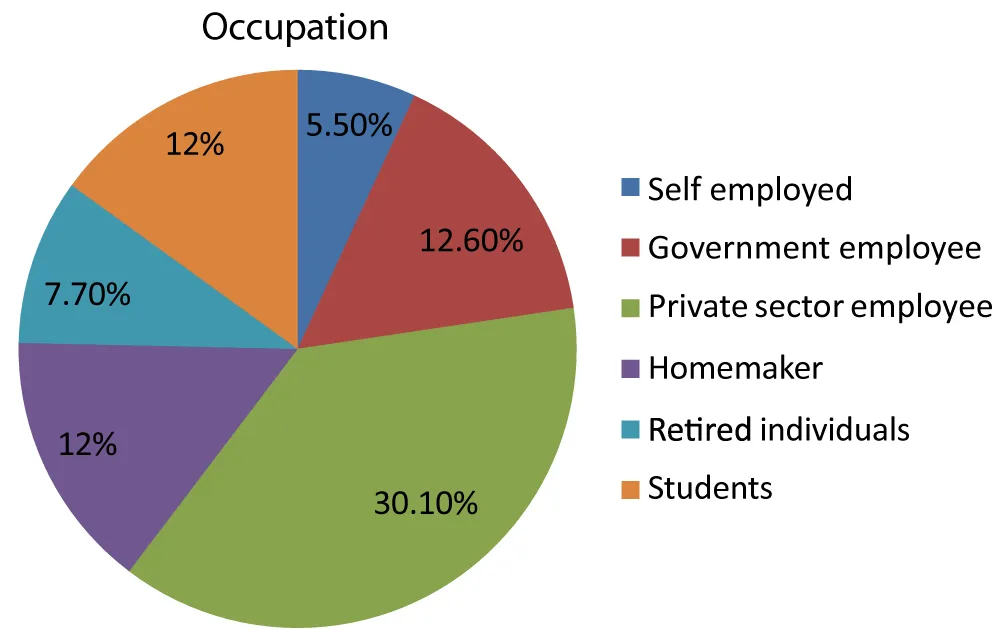
Figure 4: Occupation.
| Table 5: Monthly Income. | ||
| Monthly income | No. of respondents | Percentage |
| Below ₹10,000 | 68 | 39.1% |
| ₹10,000-25,000 | 41 | 23.6% |
| ₹25,000-50,000 | 43 | 24.7% |
| ₹50,000-1,00,000 | 17 | 9.8% |
| Above ₹1,00,000 | 5 | 2.9% |
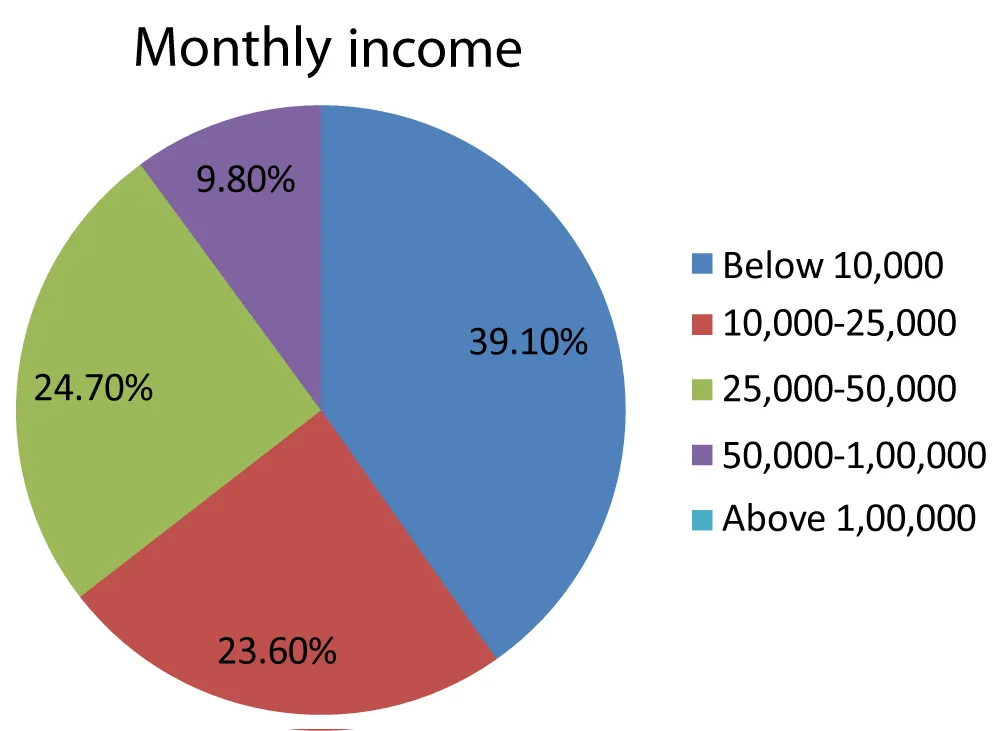
Figure 5: Monthly Income.
| Table 6: Area of Residence. | ||
| Area | No. of respondents | Percentage |
| Urban | 83 | 45.4% |
| Rural | 100 | 54.6% |
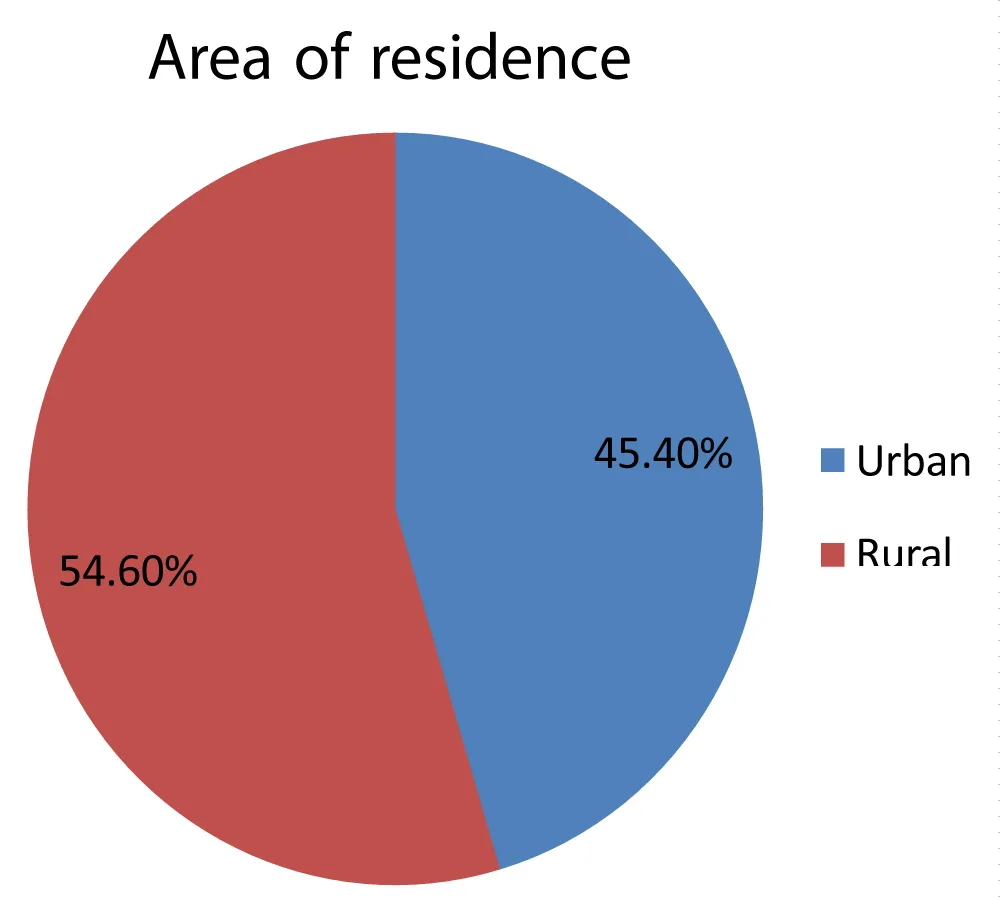
Figure 6: Area of Residence.
| Table 7: Preferred UPI Application. | ||
| UPI application | No. of respondents | Percentage |
| Google pay | 108 | 59% |
| Paytm | 22 | 12% |
| BHIM | 26 | 14.2% |
| PhonePe | 23 | 12.6% |
| Others | 4 | 2.2% |
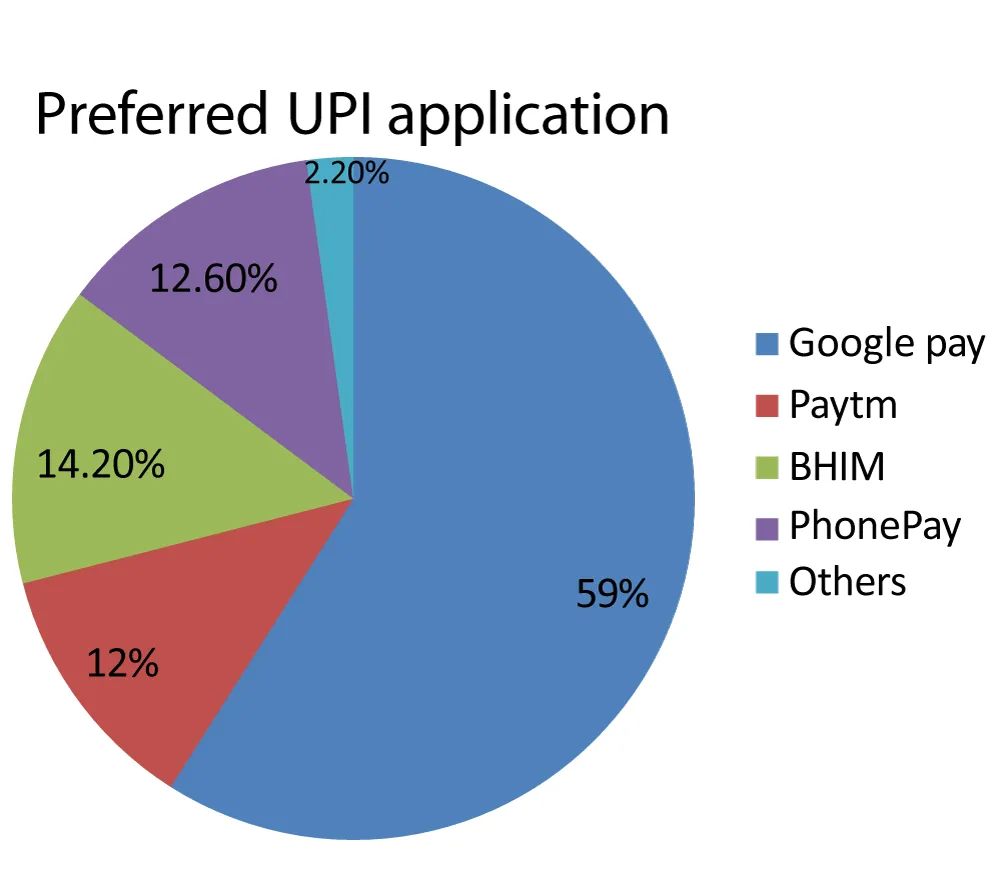
Figure 7: Preferred UPI Application.
| Table 8: Frequency of UPI Usage. | ||
| Frequency | No. of respondents | Percentage |
| Daily | 54 | 29.5% |
| 2-3 times a week | 28 | 15.3% |
| Weekly | 15 | 8.2% |
| Monthly | 47 | 25.7% |
| Rarely | 39 | 21.3% |
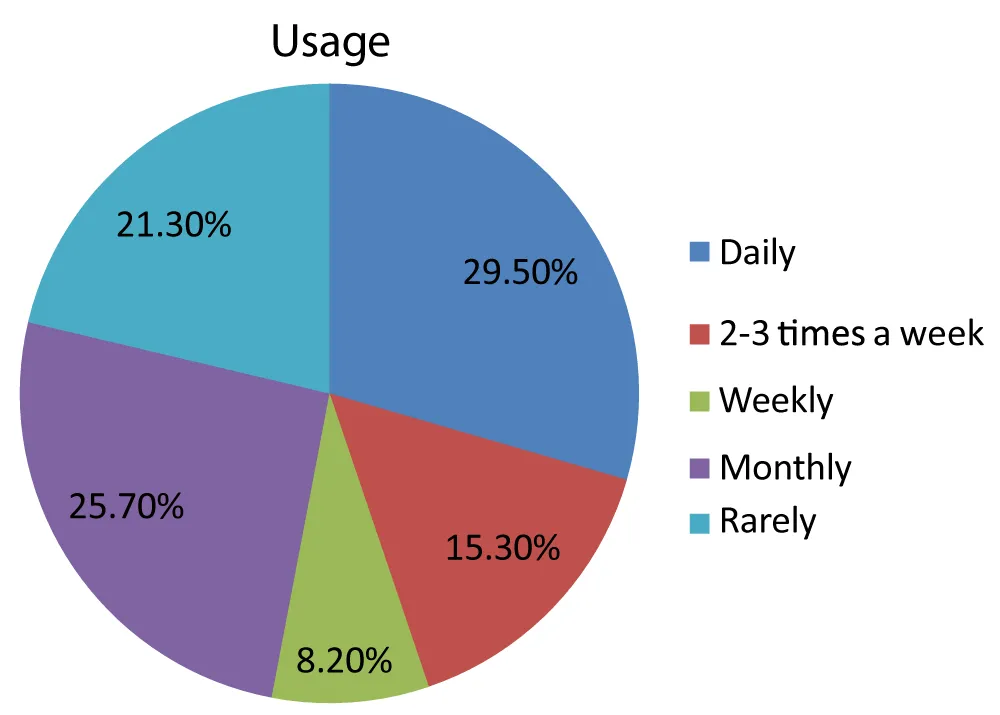
Figure 8: Frequency of UPI Usage.
| Table 9: Purpose of UPI Usage. | ||
| Purpose | No. of responses | Percentage |
| Bills payment | 63 | 34.4% |
| Shopping | 56 | 30.6% |
| Peer-to-peer transfer | 17 | 9.3% |
| Merchant payments | 28 | 15.3% |
| Others | 19 | 10.4% |
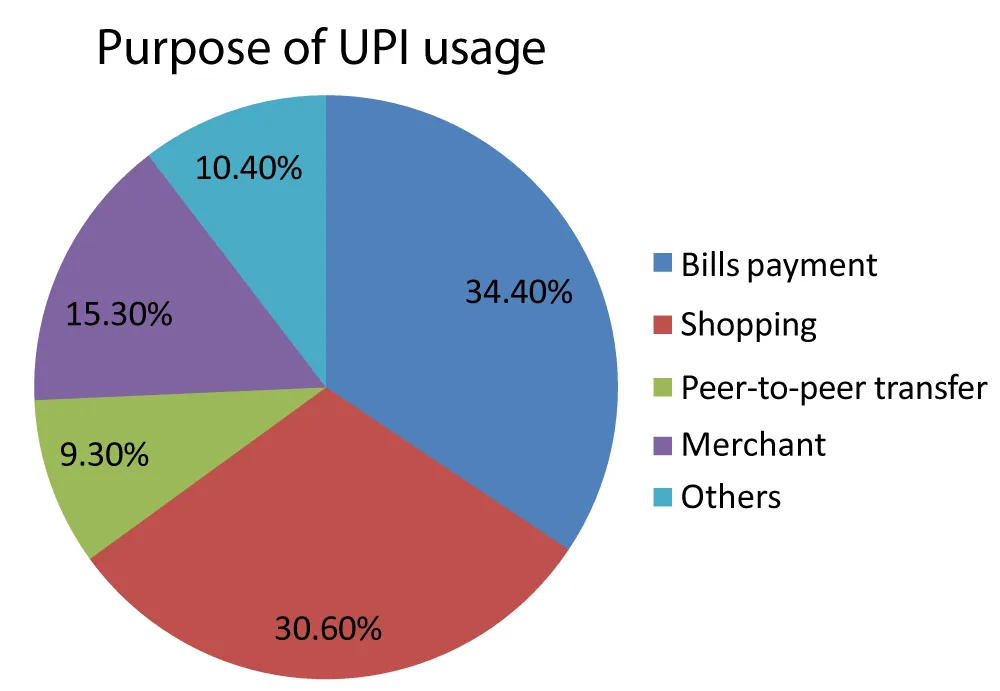
Figure 9: Purpose of UPI Usage.
| Table 10: Transaction Amount per Payment. | ||
| Amount | No. of respondents | Percentage |
| Below 500 | 54 | 29.5% |
| 500-2,000 | 85 | 46.4% |
| 2,000-5,000 | 25 | 13.7% |
| 5,000-10,000 | 11 | 6% |
| Above 10,000 | 8 | 4.4% |
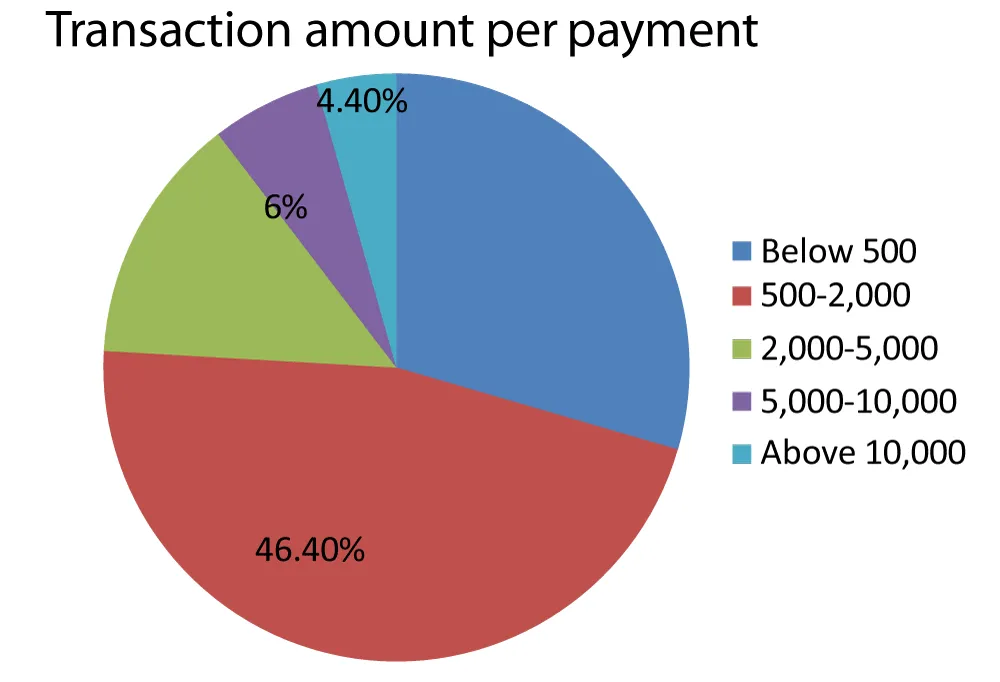
Figure 10: Transaction Amount per Payment.
| Table 11: Confidence in using UPI. | ||
| Confidence in using UPI | No. of responses | Percentage |
| Very confident | 67 | 36.6% |
| Somewhat confident | 51 | 27.9% |
| Neutral | 46 | 25.1% |
| Somewhat unconfident | 11 | 6% |
| Not confident | 8 | 4.4% |
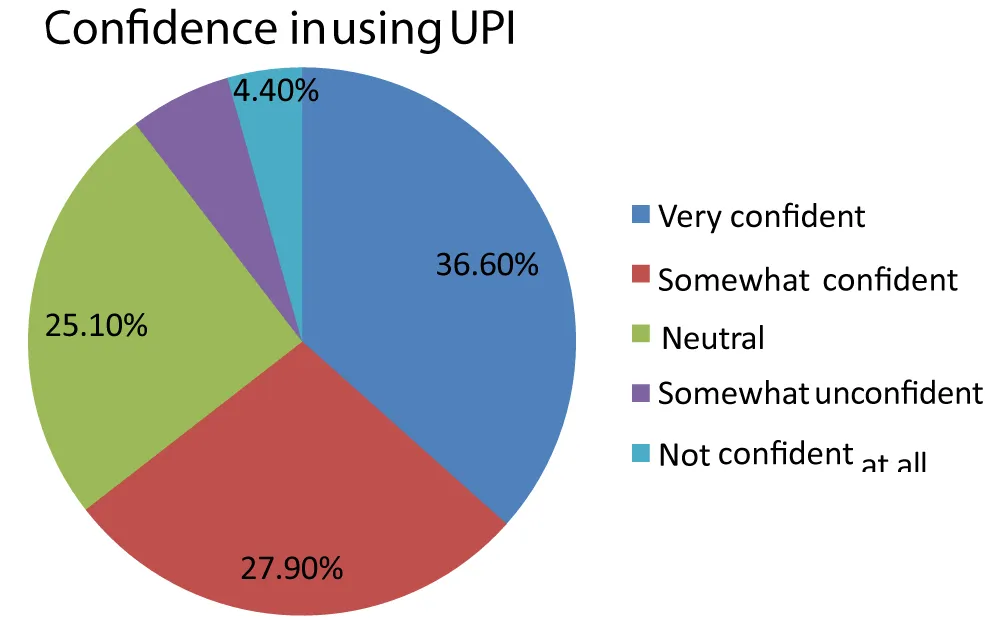
Figure 11: Confidence in using UPI.
Overall, the analysis shows that UPI usage is widespread across age, gender, education, occupation, income, and geographic groups, with increasing adoption in rural areas and a preference for trusted applications. The findings also highlight the importance of targeted initiatives to build user confidence and strengthen fraud prevention.
The analysis of responses revealed significant insights into demographic and socioeconomic factors, UPI usage patterns, awareness of fraud, and factors influencing vulnerability.
Demographic and socioeconomic factors
The majority of respondents were in the 18–25 years and 41–60 years age groups, indicating high engagement among young and middle-aged adults. Educationally qualified graduates formed the largest group, followed by postgraduates, suggesting greater UPI adoption among educated individuals. Occupationally, most respondents were engaged in the private sector, while rural users slightly outnumbered urban users, reflecting the growing penetration of digital payments in non-urban areas.
UPI usage patterns
Google Pay emerged as the most commonly used UPI application. Usage frequency varied, with a substantial proportion of respondents using UPI either daily or monthly. The primary purposes of transactions were bill payments and shopping, and the majority of respondents conducted smaller value transactions, typically in the range of routine household or personal expenses.
Awareness and preventive practices
A high proportion (96.2%) of respondents were aware of the existence of UPI frauds, with news sources and friends or family being the main channels of information. Despite high general awareness of UPI frauds, 52.5% reported having experienced fraud, suggesting that awareness alone may not translate into accurate risk assessment or safe digital behavior. The most common frauds reported were phishing calls and social engineering scams. Reporting of fraud was low: only 18.2% reported incidents to banks or cybersecurity authorities, while 42.4% did not report at all.
Contingency analysis
Cross-tabulation patterns indicated that a higher proportion of fraud experiences were observed among respondents in the 18–25 years, 41–60 years, and less educated users. Although rural users were more numerous, urban users exhibited a higher proportional victimization rate. Confidence showed a relationship with fraud experience. However, confidence does not necessarily indicate cybersecurity knowledge. Overconfidence may reduce caution, while low confidence may reflect inadequate digital skills, both contributing to increased vulnerability. No significant gender differences were observed in fraud experiences.
Overall, the study indicates that UPI fraud vulnerability is influenced by multiple factors, including age, education, income, area of residence, and user confidence. Young adults, middle-aged users, lower-educated, and lower-income groups were found to be particularly susceptible, emphasizing the need for targeted awareness and protective measures.
The study indicates that UPI fraud vulnerability is influenced by age, education, income, area of residence, and user confidence. High awareness alone does not guarantee safe usage, as behavioral factors and inadequate reporting mechanisms contribute to substantial victimization. Young adults (18–25 years), middle-aged users (41–60 years), and lower-educated and lower-income individuals were found to be particularly susceptible. Moreover, both overconfident and underconfident users experienced higher fraud, highlighting the complex interplay between knowledge and behaviorand risk. The findings underscore the need for targeted awareness campaigns, user-friendly preventive tools, and simplified reporting processes. Collaborative efforts among policymakers, financial institutions, app developers, and users are essential to strengthen digital payment security and ensure safe UPI adoption.
The study was limited to Shimla district, restricting the generalizability of the findings to other regions with different demographics or digital literacy levels. The sample size of 183 respondents, while sufficient for initial insights, may not capture all patterns of fraud vulnerability. Self-reported data on fraud experiences and preventive measures may be affected by recall bias or underreporting. Furthermore, the study did not include perspectives from non-users or financial institutions, which could have provided a more comprehensive understanding of systemic issues.
Future research could extend similar studies to other districts or states to compare regional patterns of UPI fraud vulnerability. The effectiveness of targeted digital literacy campaigns and fraud prevention programs can be evaluated alongside the role of app design, user interface, and security features in promoting safe usage. Further studies could explore the impact of emerging technologies such as AI-based fraud detection and real-time alerts on enhancing user protection.
This study analyzed UPI usage and fraud experiences among 183 respondents in Shimla district, considering demographic, socio-economic, and behavioral factors. Google Pay emerged as the most commonly used platform, and transactions were primarily for bill payments and shopping, usually involving smaller amounts. Despite high general awareness of UPI frauds, over half of respondents reported experiencing fraud, with phishing calls and social engineering scams being the most common. Reporting of fraud was low, indicating a gap between awareness and preventive practices. Confidence in UPI use influenced vulnerability, with both extremes of confidence associated with higher fraud. The findings demonstrate that UPI usage is widespread across various demographic and geographic groups, but susceptibility varies based on age, education, income, and user behavior.
- Mahesh A, Ganesh Bhat. Digital payment service in India – A case study of Unified Payment Interface. Int J Case Stud Bus IT Educ. 2021. Available from: https://doi.org/10.47992/IJCSBE.2581.6942.0114
- Rastogi S, Panse C, Sharma A, Bhimavarapu VM. Unified Payment Interface (UPI): A digital innovation and its impact on financial inclusion and economic development. Univ J Account Finance. 2021. Available from: https://doi.org/10.13189/ujaf.2021.090326
- Sahoo DK, Patnaik BCM, Satpathy I. Adoption of Unified Payment Interface (UPI): A literature review. J Orient Inst. 2024. Available from: https://doi.org/10.8224/journaloi.v73i2.141
- Modwel G, Trivedi M. The impact of Unified Payment Interface (UPI) on financial inclusion and economic development. Educ Adm Theory Pract. 2024. Available from: https://doi.org/10.53555/kuey.v30i5.3494
- Kumar R, Kishore S, Lu H, Prakash A. Security analysis of Unified Payments Interface and payment apps in India. In: Proc 29th USENIX Security Symposium. 2020. Available from: https://www.usenix.org/conference/usenixsecurity20/presentation/kumar
- Bureau. Anatomy of fraud report 2023. 2023. Available from: https://www.bureau.id/blog/anatomy-of-fraud-report-blog-2023-proactive-strategies-to-combat-rising-fraud
- Asokan. Youth are most vulnerable to UPI scams, phishing attacks: Report. The Times of India. 2021 Jun 22. Available from: https://timesofindia.indiatimes.com/business/india-business/youth-most-vulnerable-to-upi-scams-phishing-attack-report/articleshow/83585361.cms
- Khatter K, Soni J. Demographic perception towards UPI: Indian perspective. Res Militaris. 2023. Available from: https://resmilitaris.net/uploads/paper/22f611925c5ed2cd8cbcb20be1f4a136.pdf
- Mukhopadhyay N, Mukhopadhyay M. UPI frauds: A study on UPI usage, awareness and impact in India. Int J Res Commer Manag Stud. 2024. Available from: https://doi.org/10.38193/IJRCMS.2024.6616
- Sarkar S, Pareek G. Rising UPI frauds in India: Lack of digital financial literacy. Int J Adv Res Eng Sci Manag. 2024. Available from: https://www.ijaresm.com/rising-upi-fraud-in-india-lack-of-digital-financial-literacy
- Shruthi RH, Gautam S, Ranjith V. An analysis of UPI’s security risks and remediation strategies. SSRN. 2024. Available from: https://ssrn.com/abstract=4906604
- Swapna NS, Kanthimathinath D. Understanding UPI payment adoption among rural women. J Digit Econ. 2025. Available from: https://papers.ssrn.com/sol3/Delivery.cfm/064baad7-8c92-4450-b729-fbabde79da33-MEC
- Leena BD, Deshpande K. Unified Payment Interface (UPI) platform: Conniving tool for social engineering attacks. Pac Bus Rev Int. 2021. Available from: https://www.researchgate.net/publication/357837725_Unified_Payment_Interface_UPI_platform_Conniving_tool_for_Social_Engineering_Attack
- Anirud. Study of vulnerable UPI user groups and their associated risk mitigation strategies. 2022. Available from: https://www.irte.com/blog/Study-of-vulnerable-upi-user-groups-and-their-associated-risk-mitigation-strategies
- R S. The use of malware in UPI-related fraud. Dvara Research. 2023. Available from: https://dvararesearch.com/the-use-of-malware-in-upi-related-fraud/
- Kumari S. An empirical study on gender perception towards UPI. Anusandhan J Res. 2023. Available from: https://qtanalytics.in/journals/index.php/ANUSANDHAN/article/download/1518/872
- Jagtap SS. Evaluating user perceptions and security concerns in Unified Payments Interface (UPI) services. Int J Res Publ Rev. 2024. Available from: https://www.researchgate.net/publication/383518191_Evaluating_User_Perceptions_and_Security_Concerns_in_Unified_Payments_Interface_UPI_Services