
More Information
Submitted: October 21, 2025 | Approved: October 29, 2025 | Published: October 30, 2025
How to cite this article: Amir A, Sharma D, Zeeshan M, Tripathi S. Difference between Fingerprint Patterns among the South Indian and North Indian Population. J Forensic Sci Res. 2025; 9(2): 210-215. Available from:
https://dx.doi.org/10.29328/journal.jfsr.1001105
DOI: 10.29328/journal.jfsr.1001105
Copyright license: © 2025 Amir A, et al. This is an open access article distributed under the Creative Commons Attribution License, which permits unrestricted use, distribution, and reproduction in any medium, provided the original work is properly cited.
Keywords: Fingerprint patterns; Diversity; Indian population; Dermatoglyphics; Criminal investigation; Fingerprint classification

Difference between Fingerprint Patterns among the South Indian and North Indian Population
Amaan Amir1*, Deepika Sharma1, Mohd Zeeshan2 and Saumya Tripathi3
1M.Sc. Student, Department of Forensic Science, Teerthanker Mahaveer University, Moradabad, Uttar Pradesh, 244001, India
2M.Sc. Student, Department of Medical Elementology & Toxicology, School of Chemical and Life Sciences, Jamia Hamdard, New Delhi, Delhi 110062, India
3Assistant Professor, Department of Forensic Science, Teerthanker Mahaveer University, Moradabad, Uttar Pradesh, 244001, India
*Address for Correspondence: Amaan Amir, M.Sc. Student, Department of Forensic Science, Teerthanker Mahaveer University, Moradabad, Uttar Pradesh, 244001, India, Email: [email protected]
Introduction: The study of fingerprint identification is known as Dactylography or Dactyloscopy. With advances in the field of forensic sciences, fingerprints have been used as a very Effective means of establishing the identity of the individual. A fingerprint is considered to be the most accurate and reliable indicator in identification.
Objectives: The present study was conducted on 200 north Indian and south Indian subjects to determine the individuality and the predominant fingerprint pattern among both populations.
Subjects and materials: 200 people which consisting of 50 males and 50 females having the north Indian origin, and 50 males and 50 females having the south Indian origin, were included for this study. The subjects selected were in the age range between 18 and 25 years. Fingerprints were obtained using an inked stamp pad.
Results: Each type of Fingerprint pattern was identified and analysed for gender differences and its Distribution in the population. The most frequent fingerprint pattern was ulnar loop in the total population, as well as in the sex wise distribution.
Conclusion: This diversity in fingerprint patterns between the two populations highlights the need for further investigation into linking Individuals to specific groups across a wider range of populations. Therefore, it is imperative to conduct similar studies on a larger scale to enhance the accuracy of predictions and establish the unique characteristics of everyone.
A fingerprint is an impression or mark left on a surface by a person's fingertip, which can be utilized for identifying individuals based on the unique pattern of lines present on the fingertip. The ridge patterns begin to form between the fifth and sixth weeks of intrauterine life, are completely developed by the 21st week, and remain permanent throughout a person's life [1].
In the late 19th century, specifically around 1880, Faulds proposed the initial idea that fingerprints could assist in solving murders. Subsequently, the contributions of Galton and Henry demonstrated that fingerprints are an effective resource in criminal investigations [2]. The identification of individuals through fingerprints relies on two fundamental concepts: firstly, the unique patterns of papillary ridges vary among individuals and even among their own fingers, and secondly, these patterns remain unchanged from birth [3]. To identify a suspect using their fingerprints, it is essential to have a precise match between a fingerprint found at a crime scene and an ink record of the suspect’s finger [4].
Forensic experts have used fingerprints as the gold standard for personal Identification for almost a century. Fingerprints are frequently utilized as tools to uncover an individual’s identity by helping to grasp their uniqueness. The hands are A person’s most important physical part, because without them, most crimes cannot be committed. Since fingerprints are permanent, they don’t change over the course of a person’s life [5].
The friction ridge is adorned with pores that initiate the release of perspiration. It is primarily composed of water (98.5%) and also contains natural acid, salt (sodium Chloride), urea, and occasionally a minute amount of albumin. Some of the finer and much less developed ridges appear, that is referred to as nascent ridges [6].
Fingerprints found at the crime scenes or developed in the laboratory are categorized as patent, latent, or plastic impressions.
Latent prints
Fingerprints are left all over the place, even if the person is not aware of it! Sweat and oil present on the surface of the skin are the ingredients that make up latent fingerprints. This kind of fingerprint cannot be seen with the unaided eye and needs special processing to be viewed. Chemicals or simple powder methods may be used in this preparation. A latent fingerprint could also reveal the presence of a person at a crime scene [7].
Patent prints
Patent Fingerprint, also known as the Visible Fingerprint, is deliberately created by an individual to establish their identity. During the identification process, it serves to document an individual’s presence. Patent Fingerprints can be produced using substances such as blood, grease, ink, or dirt, among others [8]. This type of fingerprint is easily visible to the human eye.
Plastic prints
The plastic prints are the three-dimensional fingerprints created by pressing the fingertips into tar, soap, wax, or fresh paint. Plastic fingerprints can be viewed with the naked eye and don't need to be processed further to be visible, just like patent fingerprints [9].
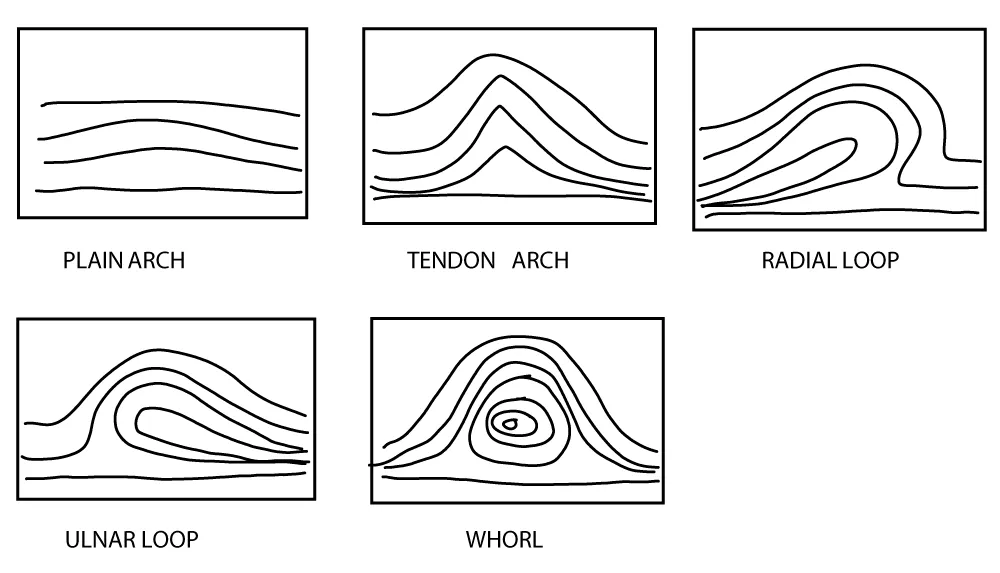
There are four fundamental types of fingerprints: composites, whorls, loops, and Arches.
Material required
The following tools were selected for the collection of comparison and all findings below (Figure 1).
- Fingerprint collection form
- Ink pad
- Magnify glass
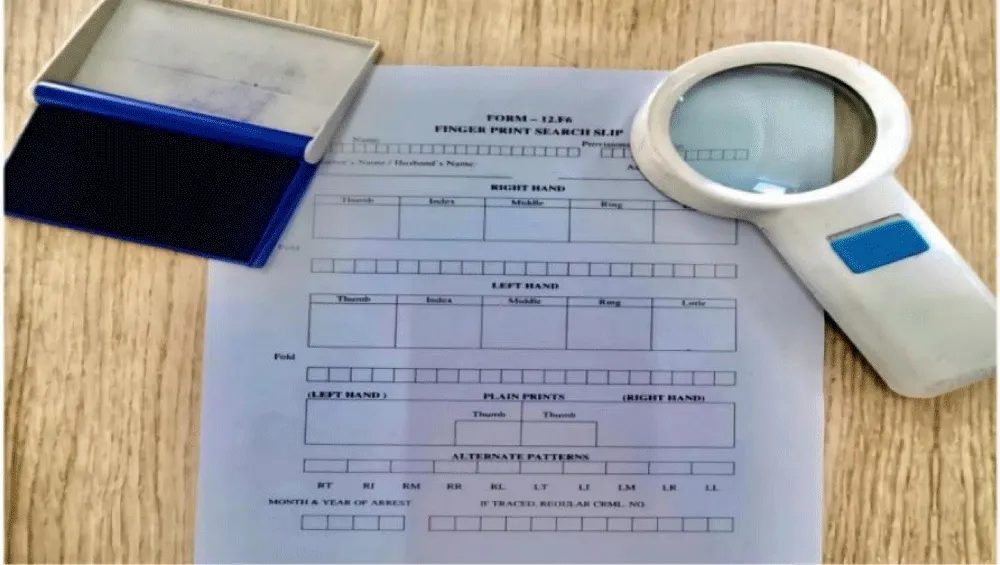
Figure 1: Tools required.
Sample collection
In the present study, 200 samples of fingerprints were collected, which consist of 50 Males and 50 females having the South Indian origin, followed by 50 males and 50 Females having the North Indian origin, with the help of an ink pad on the fingerprint Card (Figure 2).
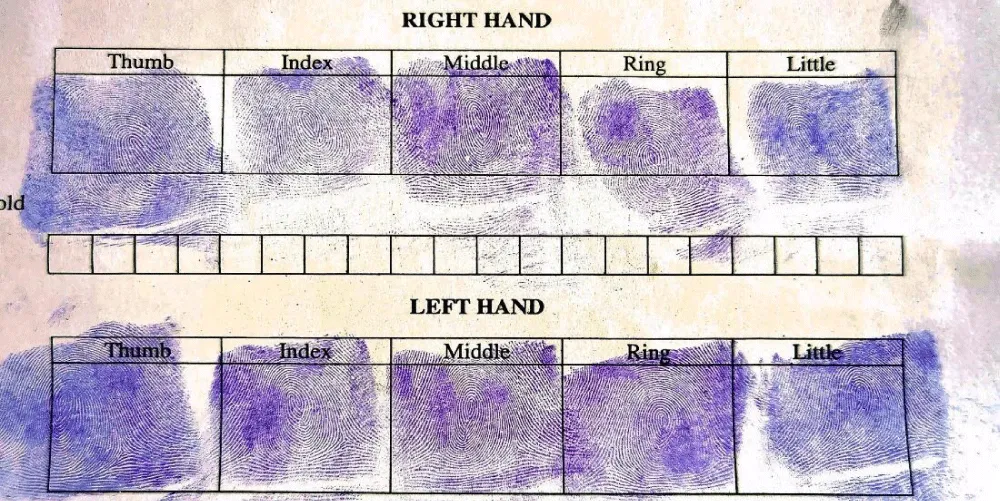
Figure 2: Fingerprint collection form.
All the subjects were students studying in various institutions in India, and all the subjects were aged between 18-25 years old. Verbal consent was obtained from the subjects. After being informed of the purpose of the study, the individuals volunteered to take part in it. The individuals were helped to make their impression by having their hands and fingers held to produce more efficient and legible impressions.
The populations from North and South India were selected due to their unique regional and genetic diversity, along with practical considerations, as individuals from these groups were readily available for participation. This facilitated a thorough comparative analysis of variations in fingerprint patterns.
In the present study, fingerprints were obtained from all the subjects, and the total sample size was 200 (50 males and 50 females having South Indian origin) and (50 males and 50 females having the North Indian origin). The fingerprints from all 10 fingers were obtained and recorded in the 10-digit fingerprint collection form, and the patterns were identified using a magnifying glass. The result of the following study is shown in the tables below (Tables 1,2).
Table 1: Showing the overall distribution of fingerprint patterns; |
||
| FINGERPRINTS | FREQUENCY | PERCENTAGE |
| LOOP | 1003 | 50.1% |
| WHORL | 712 | 35.6% |
| ARCH | 213 | 10.7% |
| COMPOSITE | 72 | 3.6% |
| TOTAL | 2000 | 100% |
| Table 2: showing further classification of fingerprint patterns. | ||
| FINGERPRINTS | FREQUENCY | PERCENTAGE |
| ULNAR LOOP | 714 | 35.7% |
| RADIAL LOOP | 289 | 14.4% |
| WHORL | 712 | 35.6% |
| PLAIN ARCH | 146 | 7.3% |
| TENTED ARCH | 67 | 3.4% |
| COMPOSITE | 72 | 3.6% |
| TOTAL | 2000 | 100% |
Among the 200 subjects studied in this study, among all the fingers (2000) loop was the most frequently observed fingerprint pattern with an incredible percentage (50.1%), followed by whorl (35.6%), followed by arch (10.7%), and the least frequent Pattern was composite (3.6%) (Figure 3).
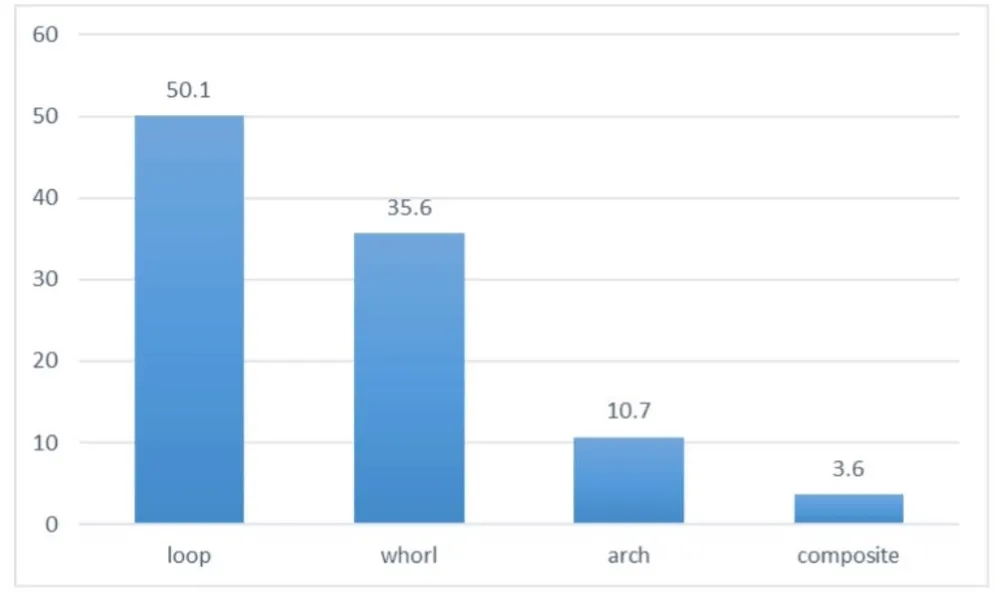
Figure 3: Showing the overall distribution of fingerprint patterns.
The above table shows that the ulnar loop was the most frequent fingerprint pattern among both populations, with the percentage of (35.7%), followed by whorl (35.6%), radial loop (14.4%), then plain arch (7.3%), composite (3.6%), and the least observed fingerprint pattern was tented arch (3.4%) (Figure 4).
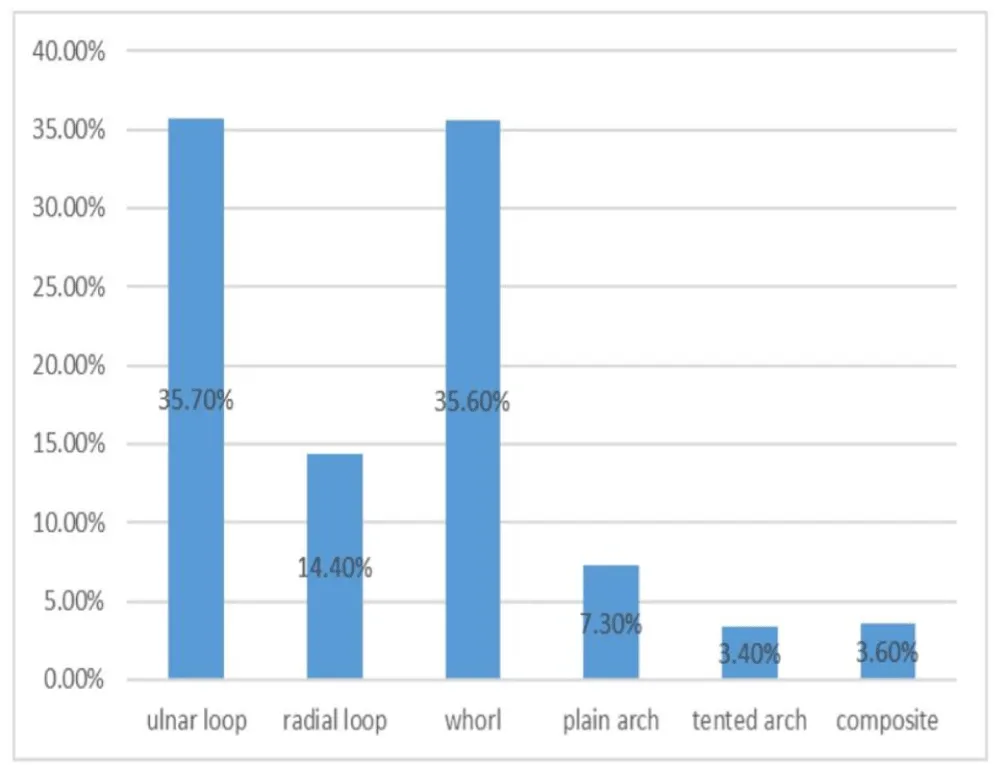
Figure 4: Showing further classification of fingerprint patterns.
This is the general fingerprint classification of both populations, including 50 males and 50 females having South Indian origin and 50 males and 50 females having North Indian origin, which shows that the ulnar loop was the most predominant fingerprint pattern.
Based on Table 3, in both sexes, the most predominant fingerprint pattern was loop. In the north Indian males, the loop was the most frequently observed fingerprint pattern (52.2%), including the ulnar loop (36.8%) and radial loop (15.4%), followed by whorl (35.6%), then the arch pattern (8%), consisting of the plain arch (5.4%) and tented arch (2.6%). And the least observed fingerprint pattern in north Indian males was composite (4.2%).
| Table 3: Showing sex wise distribution of fingerprint patterns between North Indian males and females. | ||||
| FINGERPRINTS | FREQUENCY | PERCENTAGE | ||
| MALE | FEMALE | MALE | FEMALE | |
| ULNAR LOOP | 184 | 157 | 36.8% | 31.4% |
| RADIAL LOOP | 77 | 82 | 15.4% | 16.4% |
| WOHRL | 178 | 167 | 35.6% | 33.4% |
| PLAIN ARCH | 27 | 76 | 5.4% | 10.4% |
| TENTED ARCH | 13 | 24 | 2.6% | 4.8% |
| COMPOSITE | 21 | 18 | 4.2% | 3.6% |
| TOTAL | 500 | 500 | 100% | 100% |
On the other hand, females in north Indian population studied also showed higher incidence of loop pattern (47.8%) including the ulnar loop (31.4%) and radial loop (16.4%) followed by whorl (33.4%) then arch (15.2%) including the plain arch (10.4%) and tented arch (4.8%) and the least observed fingerprint pattern in both hands of females having the north Indian origin was composite (3.6%) (Figure 5).
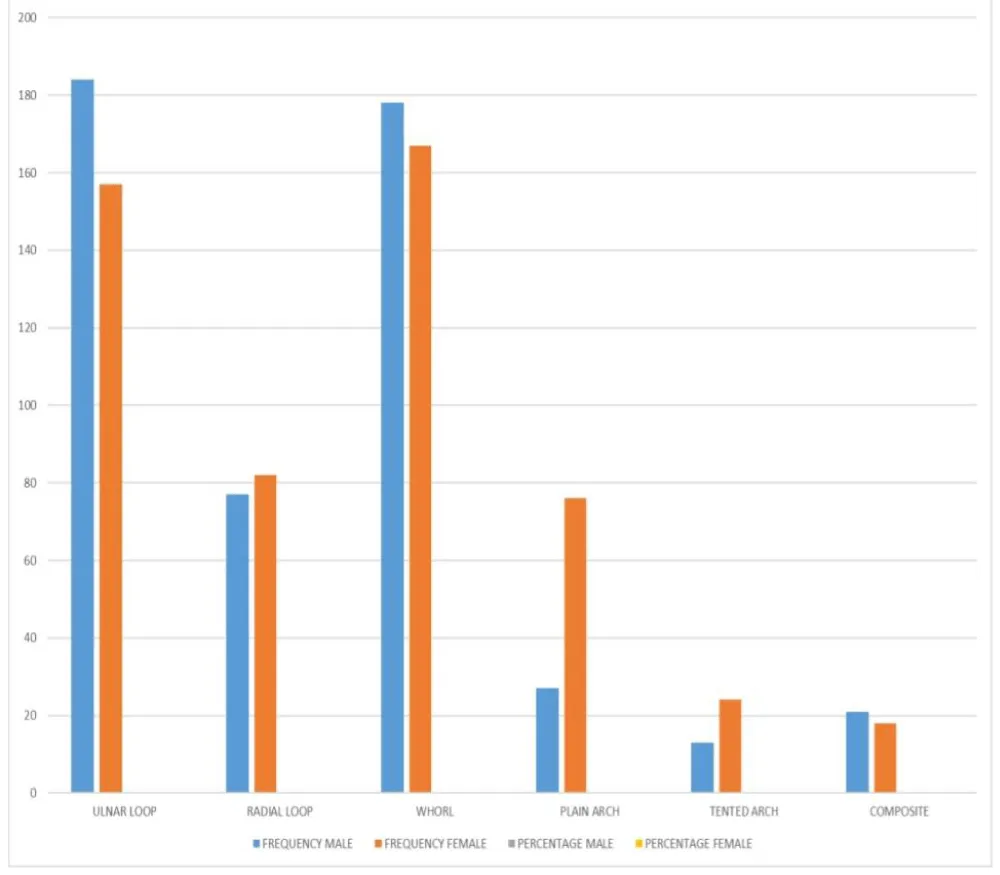
Figure 5: Showing the sex wise distribution of fingerprint patterns of the people having North Indian origin.
In the gender wise distribution, the females showed a higher frequency of arch (15.2%) compared to the males having the North Indian origin. While the males of the north Indian population showed more loops (52.2%) and whorls (35.6%) as compared to the females, who had the same origin.
Based on Table 4, in both sexes, the most predominant fingerprint pattern was loop. Same as the north Indian population in the males having the south Indian origin the loop was the most frequently observed fingerprint pattern (54.2%) including the ulnar loop (39.2%) and radial loop (15%) followed by whorl (31.2%) then the arch pattern (11.8%) consisting of the plain arch (8.2%) and tented arch (3.6%). And the least observed fingerprint pattern among the South Indian males was composite (2.8%).
| Table 4: showing sex wise distribution of fingerprint patterns between South Indian males and females. | ||||
| FINGERPRINTS | FREQUENCY | PERCENTAGE | ||
| MALE | FEMALE | MALE | FEMALE | |
| ULNAR LOOP | 196 | 177 | 39.2% | 35.4% |
| RADIAL LOOP | 75 | 55 | 15% | 11% |
| WHORL | 156 | 211 | 31.2% | 42.2% |
| PLAIN ARCH | 41 | 26 | 8.2% | 5.2% |
| TENTED ARCH | 18 | 12 | 3.6% | 2.4% |
| COMPOSITE | 14 | 19 | 2.8% | 3.8% |
| TOTAL | 500 | 500 | 100% | 100% |
On the other hand, females of the south Indian population studied also showed higher incidence of loop pattern (46.4%) including the ulnar loop (35.4%) and radial loop (11%) followed by whorl (42.2%) then arch (7.6%) including the plain arch (5.2%) and tented arch (2.4%) and the least observed fingerprint pattern in both hands of females having the south Indian origin was composite (3.8%) (Figure 6).
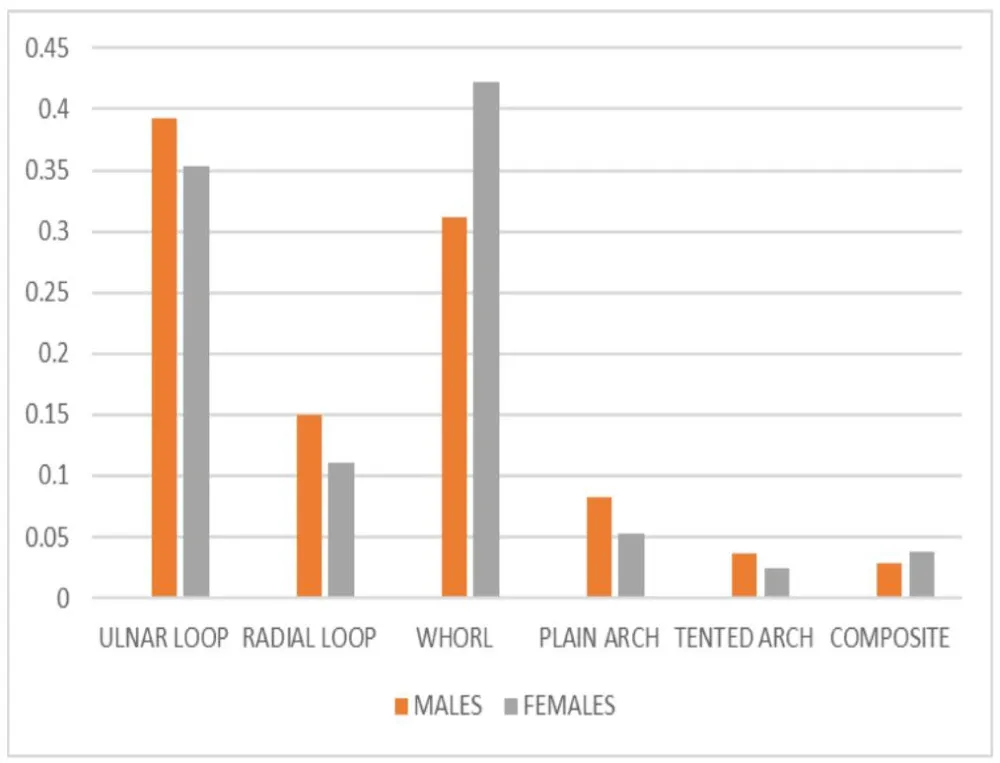
Figure 6: Showing sex wise distribution of fingerprint patterns of the people having South Indian origin.
In the gender wise distribution, the males of the south Indian population showed the more frequency of the loop pattern (54.2%) including ulnar loop (39.2%) and radial loop (15%) followed by the arch pattern (11.8%) including the plain arch (8.2%) and tented arch (3.6%) compared to the females having the same origin. While the females of the south Indian population showed a high frequency of whorl pattern (42.4%), as compared to the males having the same origin. Rolled fingerprints of both hands of all 200 subjects were collected. These were analysed and their patterns were determined.
Among the 200 subjects, it was seen that loops were 101(50.1%), whorls were 71(35.6%), arches were 21(10.7%), and composites were 7(3.6%) shown in Table 1. The distribution of different patterns of fingerprints was analyzed separately for both males and females. Shown in (Graph 3) Present study showed that in males having the north Indian origin the most common type of pattern was loop (52.2%) consisting the ulnar loop (36.8%) and radial loop (15.4%) followed by whorl (35.6%) and then arch (8%) including the plain arch (5.4%) and tented arch (4.8%) and the least fingerprint pattern observed in the north Indian males was composite (4.2%)
In females of the north Indian population the most common type of fingerprint pattern was loop (47.8%) including the ulnar loop (31.4%) and radial loop (16.4%) followed by whorl (33.4%) and then arch (15.2%) including the plain arch (10.4%) and tented arch (4.8%) and the least fingerprint pattern was the composite (3.6%). Same as the south Indian population in males the most frequently observed fingerprint pattern was loop (54.2%) consisting of the ulnar loop (39.2%) and radial loop (15%) followed by whorl (31.2%) then the arch (11.8%) including the plain arch (8.2%) and tented arch (3.6%) and the least frequent pattern was composite (2.8%).
On the other hand, the females having the south Indian origin also shown the higher frequency of loop patterns (46.4%) in both hands including the ulnar loop (35.4%) and radial loop (11%) followed by whorl (42.2%) then the arch (7.6%) including the plain arch (5.2%) and tented arch (2.4%) and the least frequent pattern was composite (3.6%). We compared which of the four fingerprint patterns was the most prevalent, and we discovered that in the 2000 fingerprints, the loop pattern (1003 cases) was the most common, followed by the whorl (712 cases) and the arch (213 cases). Composite was the least frequent (72 cases).
After comparing various fingerprint patterns across genders, we discovered that the loop shape fingerprint pattern was more common in males (both north and south males) respectively (52.2%) and (54.2%) than in females (both north and south females) respectively (47.8%) and (46.4%) Among both populations the second most common kind of fingerprint pattern was the whorl. In males (both north and south) respectively (35.6%) and (31.2) and in females (both north and south Indian) respectively (33.4%), and (42.2%) followed by arch fingerprints in both males respectively (8%) and (11.8%) and in both females respectively (15.2%), and (7.6%) then the composite fingerprints in both males (4.2%) and (2.8%) and females (3.6%) and (3.8%) (Table 1).
Fingerprints comparison is widely recognized as a reliable technique for confirming an individual's identity. The primary aim of this research was to determine the prevalence of fingerprints and their distribution based on gender within the South Indian and North Indian communities.
In the present study, the blue ink pad is used to record the fingerprint patterns. These days, obtaining fingerprint data can be a challenging task due to the lack of trust from the subjects. This is because individuals may fear that their identity and related information could be misused. To address this concern, it was clearly communicated that the collected data would only be used for specific research purposes. And provided verbal consent before proceeding. As a result of this transparency, subjects willingly participated in the study.
At the end, we discovered that the most popular pattern was a loop, whereas composite was less prevalent. When we compared the previous data with the present data, it was found that:
- The prevalence of loops ranges from 57.8% in the historical records and is 50.1% according to the current study.
- The whorl prevalence ranges from 30.4% which is now 35.6% according to the current study.
- The prevalence of the arch pattern ranges from 6.5% to 10.7% according to this study.
- The prevalence of the composite patterns ranges from 5.3% but we found it to be 3.6% in this study.
Upon examining the distribution of fingerprint patterns in each gender, we observe that loops are the most prevalent pattern in both sexes, followed by whorls, arches, and composites.
Dermatoglyphics has been extensively recorded as a scientific and valuable method for medico-legal, anthropological, and genetic research. Due to the polygenic nature of dermatoglyphic pattern inheritance, the frequencies of arches, loops, and whorls can differ among populations. Therefore, our research indicates variations in Fingerprint patterns between the north Indian and south Indian populations, specifically for loop, whorls, and arches. This diversity in fingerprint patterns between the two populations highlights the need for further investigation into linking individuals to specific groups across a wider range of populations. Fingerprints have long been recognized as a well-established method of Identification. Therefore, it is imperative to conduct similar studies on a larger scale to enhance the accuracy of predictions and establish the unique characteristics of everyone.
Participants consent
Verbal consent was obtained from all the subjects. After being informed of the purpose of the study, the individuals volunteered to take part in it. The individuals were helped to make their impression by having their hands and fingers held to produce more efficient and legible impressions.
I would like to express heartfelt gratitude to all the mentors, colleagues, and institutional authorities for their continuous support, insightful feedback, and encouragement that made this research possible.
- Bansal HD, Badiye AD, Kapoor NS. Distribution of fingerprint patterns in an Indian population. Malays J Forensic Sci. 2014;5(2):18–21. Available from: https://www.researchgate.net/publication/272676488_Distribution_of_Fingerprint_Patterns_in_an_Indian_Population
- Berry J, Stoney DA. The history and development of fingerprinting. In: Lee HC, Gaensslen RE, editors. Advances in Fingerprint Technology. 2nd ed. Boca Raton (FL): CRC Press; 2001;13–52.
- Bleay SM, Croxton RS, De Puit M. Fingerprint Development Techniques: Theory and Application. Hoboken (NJ): Wiley; 2018. Available from: https://onlinelibrary.wiley.com/doi/book/10.1002/9781119187400
- Nagar V, Tripathi K, Aseri V, Mavry B, Chopade RL, Verma R, et al. Latent friction ridge analysis of developed fingerprints after treatment with various liquid materials on a porous surface. Mater Today Proc. 2022;69:1532–1536. Available from: https://doi.org/10.1016/j.matpr.2022.04.619
- Binorkar SV, Kulkarni AB. Study on the fingerprint pattern and gender distribution in and around the Nanded district of Maharashtra State. Int J Forensic Med Invest. 2017;3(1):12–18.
- Yao Z, Le Bars JM, Charrier C, Rosenberger C. Literature review of fingerprint quality assessment and its evaluation. IET Biometrics. 2016;5(3):243–251. Available from: https://doi.org/10.1049/iet-bmt.2015.0027
- Valdes-Ramirez D, Medina-Pérez MA, Monroy R, Loyola-González O, Rodríguez J, Morales A, et al. A review of fingerprint feature representations and their applications for latent fingerprint identification: trends and evaluation. IEEE Access. 2019;PP(99):1–1. Available from: https://doi.org/10.1109/ACCESS.2019.2909497
- Chandana S, Yadav S, Mathuria M. Fingerprint recognition based on minutiae information. Int J Eng Res Technol. 2015;120(10):39–42. Available from: https://doi.org/10.5120/21265-3862
- Hassan A, Tripathi A, Kumar A, Patel A, Singh KS, Kalsi R, et al. Study of fingerprint patterns in the North Indian population. IOSR J Dent Med Sci. 2020;19(3 Suppl 9):31–34. Available from: https://www.iosrjournals.org/iosr-jdms/papers/Vol19-issue3/Series-9/F1903093134.pdf