
More Information
Submitted: December 08, 2023 | Approved: December 18, 2023 | Published: December 19, 2023
How to cite this article: Janaki MC, Anil Kumar S. Forensic Comparison of Textile Fibre for Identification using X-ray Diffraction Technique. J Forensic Sci Res. 2023; 7: 083-088.
DOI: 10.29328/journal.jfsr.1001055
Copyright License: © 2023 Janaki MC, et al. This is an open access article distributed under the Creative Commons Attribution License, which permits unrestricted use, distribution, and reproduction in any medium, provided the original work is properly cited.
Keywords: Textile; Fibre; Crystalline; Cotton; Polyester; X-ray Diffraction

Forensic Comparison of Textile Fibre for Identification using X-ray Diffraction Technique
MC Janaki1* and S Anil Kumar2
1Associate Professor, Department of Forensic Science, Kalasalingam Academy of Research and Education, Srivilliputhur, Tamil Nadu, India
2Faculty, Department of Criminology and Forensic science, University of Mysore, Mysuru, Karnataka, India
*Address for Correspondence: MC Janaki, Associate Professor, Department of Forensic Science, Kalasalingam Academy of Research & Education, Srivilliputhur, Tamil Nadu, India, Email: [email protected]
This study delves into the forensic examination of textile fibers for identification through the application of the X-ray diffraction (XRD) technique. With the textile industry producing an array of materials, both natural and man-made fibers, the need to distinguish between them for forensic purposes becomes paramount. The primary objective of this research is to identify unique characteristics in fiber samples, differentiating between branded and non-branded company textiles. The focus is placed on fresh, unused cloth fibers obtained directly from shops. The study encompasses two broad categories of fibers: natural (such as cotton, silk, and wool) and man-made (including nylon, rayon, and polyester). Samples from both branded and non-branded textiles undergo analysis using XRD, a sophisticated method capable of revealing the crystallographic structure of materials. Results obtained from the XRD analysis unveil intensity peaks at various levels and degrees, providing distinctive patterns for individualization. Even within the same fiber category, such as polyester and cotton, discernible differences in intensity peaks facilitate the identification process. This research contributes to the advancement of forensic techniques by offering a reliable means of identifying textile fibers. The utilization of XRD not only allows for the differentiation between natural and man-made fibers but also enables discrimination among textiles produced by different companies. The implications of this study extend to forensic investigations, where the ability to precisely identify fibers can provide valuable evidence in criminal cases involving textiles.
Fibres obtained from natural sources have been used for the making of textiles and other products for thousands of years viz., floorings, tents, canvases, ropes, etc., can be traced back over 3000 years, and more recently textiles have found broader applications. Just like hair, fibres are also considered trace evidence. In many cases, identification or matching of fibre evidence is vital to crack a crime. Identification of fibre is as important as any other evidence because it may lead us to some of the vital information which will lead the investigation and connect the triangle of crime i.e., crime scene-victim-culprit [1].
Fibre has achieved intensified significance in forensics because of its abundant existence in the market and at crime scenes. Fibre is often encountered as trace evidence in incidents involving personal contact viz., homicide, assault, sexual offenses, as well as hit-and-run accidents and other crimes [2,3]. Fibres can also be found in or on objects incidentally associated with crimes such as, floors, wounds, blood, weapons, cars, etc. Knowledge of the chemistry of fibres and fibre dyes is significant to consider both the basis of fibre identification and the forensic significance of various fibre/dye combinations. However, the detection of a fibre and its identification as a particular fibre type or different fibre together may not by itself, provide support for a forensic investigation. In such a scenario, understanding the crystalline structure of fibre to differentiate and individualize for better understanding [4].
Recent researchers have abundantly helped in individualising the fibre and aid in identifying by using modern analytical techniques [5] used spectroscopic analysis [4] FT-IR [6], ATR-FT-IR [7] Raman imaging [8] X-Ray Diffraction [9]. When it comes to the examination of textile dye and individualising fibre is also viable [10,11], [12,13]. In forensic laboratories, the most commonly analyzed microtraces are microscopic fragments of single fibers that can also be differentiated and utilized as evidence in forensics [9]. One of the main goals of the examination of fragments of fibers a few millimeters long is to determine their characteristic physicochemical properties and compare them with fibers originating from a known source (e.g., a suspect’s clothes). The color and dyes of fiber micro traces play an important role in their research and evaluation, being analyzed by means of microscopic, spectroscopic, and chromatographic methods. The results of examinations conducted with the use of spectroscopic techniques might be ambiguous due to overlapping bands of absorption and the transmission and dispersion of electromagnetic radiation corresponding to the specific chemical structure of the fibers and their dyes. For this reason, it is very important to improve currently available spectroscopic methods and/or to propose new ones that allow evidential materials to be analysed in a much more reliable way. In this review, the possibility of the use of chromatographic techniques with different detection systems for such analyses is underlined. This review covers the different analytical methods used in the forensic analysis of polyester fibers dyed with disperse dyes. Polyester fibers occupy the first position among synthetic fibers in their use for a variety of purposes, and disperse dyes are commonly applied for dyeing them [11-13], (Hu, et al. 2018). When there is a single fibre, the analytical technique is different but, in case of blended fibres the identification of different fibres in one end product is very difficult hence, TD/Py-DART-MS method is useful in detecting such a mixture of fibres [14]. Identifying the fibre using the analytical technique as well as crystalline morphology is found whereas, the research area unexposed is comparing the same categories of fibre samples among different standard and substandard manufacturers i.e., branded and non-branded manufacturers and the present study aims at comparing such samples and to find out whether is their any differences exists in the fibre based on the standard/brand.
X-ray diffraction (XRD) is a powerful analytical technique that can be employed in forensic science for textile identification. While XRD is more commonly associated with material characterization in fields like chemistry and geology, its application in forensics, particularly in textile analysis, can provide valuable information about the composition and structure of fibers.
The forensic application of X-ray diffraction is seen in different textile fibers that exhibit unique structures. XRD is used to analyze the crystallographic structure of fibers, helping to differentiate between various types of textiles [15]. The diffraction patterns obtained from XRD can be compared with a database of known fiber patterns to identify the material accurately [16]. XRD assists in identifying individual fibers and blends within a textile sample. It can distinguish between natural fibers (such as cotton or wool) and synthetic fibers (such as polyester or nylon) based on their crystal structures [17]. XRD is been coupled with other analytical techniques to analyze trace elements present in textile fibers. This additional information can be crucial in forensic investigations where the origin of fibers or the conditions of their production are relevant [18].
While XRD is a powerful tool, it is important to note that it is often used in conjunction with other analytical techniques for comprehensive textile analysis in forensic science. Additionally, the availability of sophisticated equipment and expertise in XRD may limit its widespread application in forensic laboratories [9]. However, as technology advances, the integration of XRD into forensic protocols is becoming more feasible and contributes to the accuracy of textile identification in forensic investigations [19].
The present study is a comparative study which is qualitative in nature. Fibre samples like cotton and polyester were chosen for the study and under each category, one sample was collected from a branded and non-branded company, they were fresh and unused samples collected from the cloth shop.
Analytical analysis
Solvent extraction method of textile fibres for X-ray Diffraction analysis: Fibres were individually pulled from cloths using tweezers. Each fibre was cut into a strand of appropriate length (4 cm, 2 cm, or 5 mm) using scissors or razor blades. Tweezers, scissors, and razor blades were previously cleaned with methanol and visually examined under ultraviolet light (254 nm) to prevent the presence of fluorescence contamination. Each 4 cm or 2 cm strand was cut into pieces of approximately 5 mm in length. 5 mm strands were used as such. All pieces from one fibre were placed in a 6x50 mm glass culture tube. 200 μL of extracting solvent was added to each tube. The tubes were sealed by melting with a propane torch. Sealed tubes were placed in an oven at 100 °C for one hour. Tubes were removed from the oven, scored, and broken open. The solvent was removed with a micro-pipette and placed in a plastic vial for storage.
After the solvent was prepared the X-ray diffraction technique was applied for examination of the internal structure of the polymeric chain that exists in a fibre. Samples were also examined visually to know the standard of the cloth by studying thread count, warp & weft, weaving pattern, etc.
Findings
Table 1 respective to the sample depicted in Figure 1 summarizes the visual examination data of non-branded fibre where the sample has a plain rib weaving pattern and twists with 55 warps and 62 wefts in a 2 cm area of the sample.
Graph 1 clearly insights that the non-branded Polyester textile fibre of both sides coloured the 2θ1 value is 17.3333 and the 2θ2 value is 25.658 and the d[1] value is 5.11193 and the d[2] value is 3.46915 at the size (ang) 9.32 and 9.45 respectively. The 2θ value indicates the level of atomic numbers of cotton fibre used for the textile and the diffraction will vary according to the level of atomic number and the diffraction may increase or decrease accordingly. The unique diffraction peaks observed for fiber type serve as a fingerprint, aiding in the positive identification of fiber.
| Table 1: Visual Examination of non-branded polyester fibre. | |||||||
| Sample | Textile of | Weaving pattern | Colour on side | Twist | Number of yarns in a thread | Number of yarns in fabric(2 cm) | |
| Warp | Weft | ||||||
| Polyester | Shirt | Plain Rib | Both side | Twisted | Individual fibres | 55 | 62 |
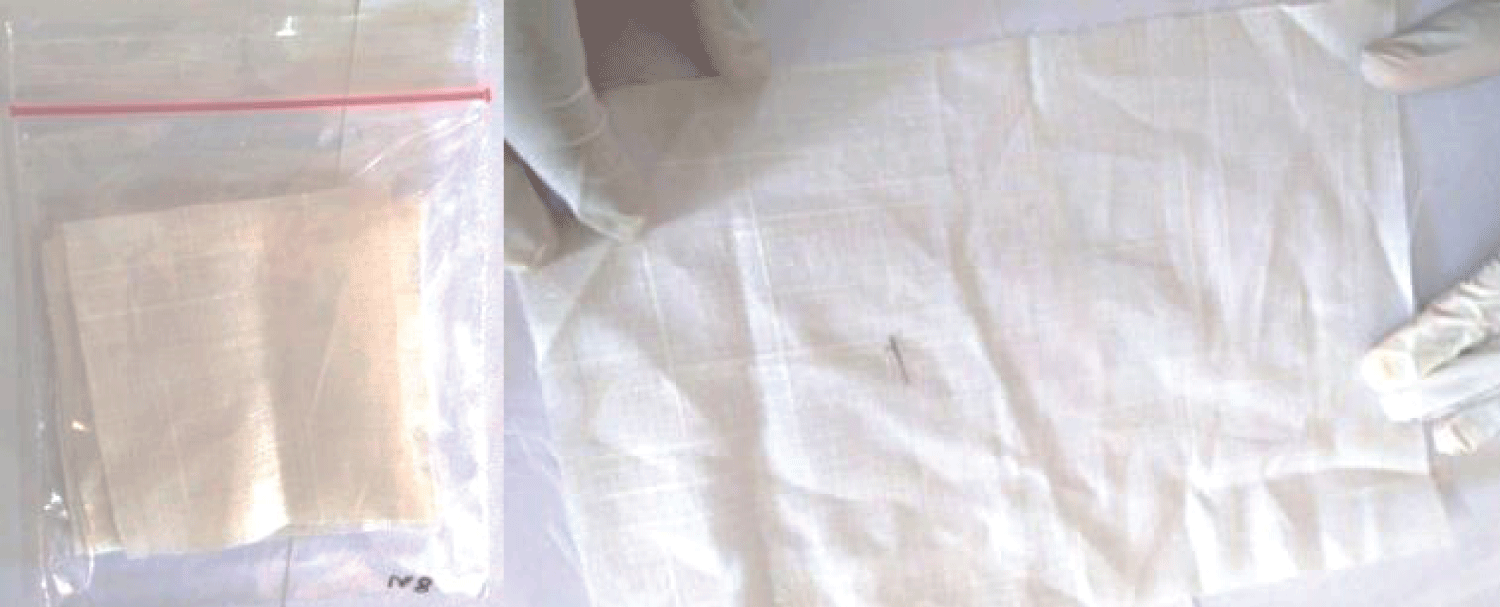
Figure 1: Non-branded Polyester cloth used for study.
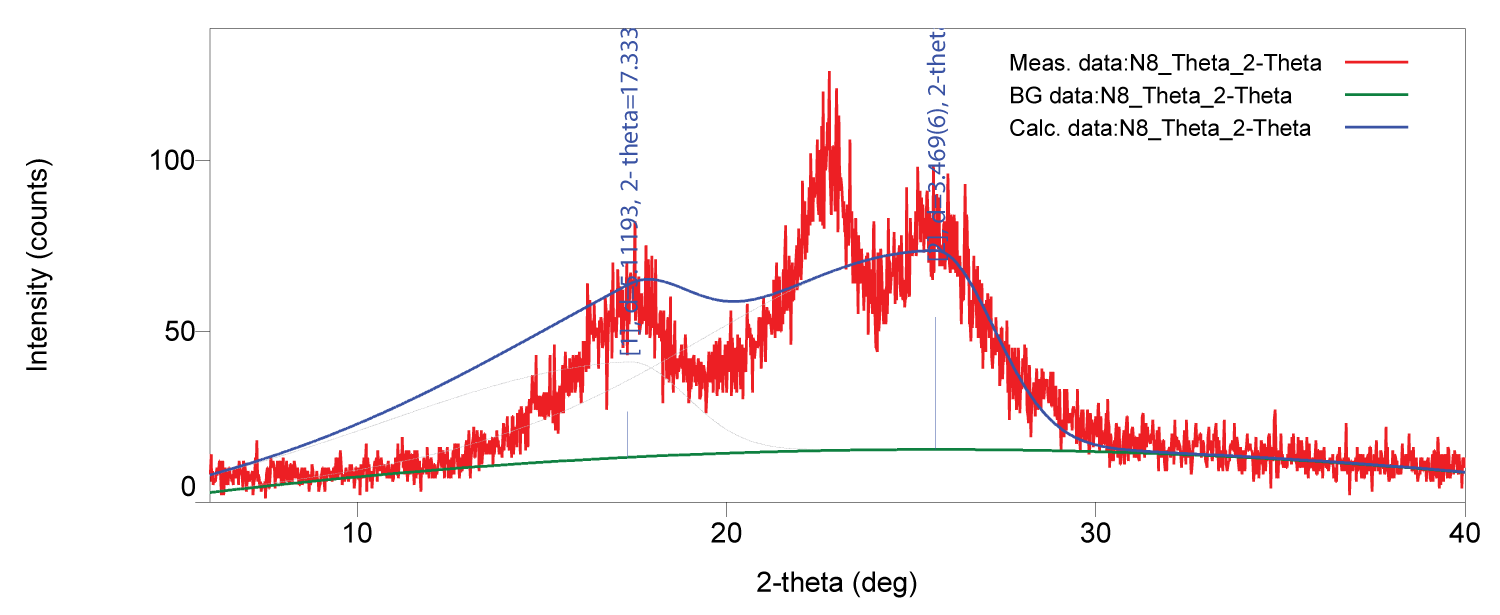
Graph 1: Intensity ratio for non-branded polyester fibre.
Table 2 with respect to the Figure 2 sample the data reveals the visual examination of non-branded fibre where the sample has a plain rib weaving pattern and twists with 42 warps and 49 wefts in a 2 cm area of the sample.
Graph 2 it is evident that the non-branded cotton textile fibre of both sides coloured the 2θ1 value is 17.7423 and the 2θ2 value is 22.8341 and the 2θ3 value is 25.9329 the d[1] value is 5.16673 and the d[2] value is 3.4321 at the size (ang) 33.32, 24.81 and 41.99 respectively. The 2θ value indicates the level of atomic numbers of cotton fibre used for the textile and the diffraction will vary according to the level of atomic number and the diffraction may increase or decrease accordingly.
| Table 2: Visual Examination of non-branded cotton fibre. | ||||||
| Textile of | Weaving pattern | Colour on side | Twist | Number of yarns in a thread | Number of yarns in fabric(2 cm) | |
| Warp | Weft | |||||
| Shirt | Plain Rib |
Both side | Twisted | Two yarns(warp &Weft) | 42 | 49 |
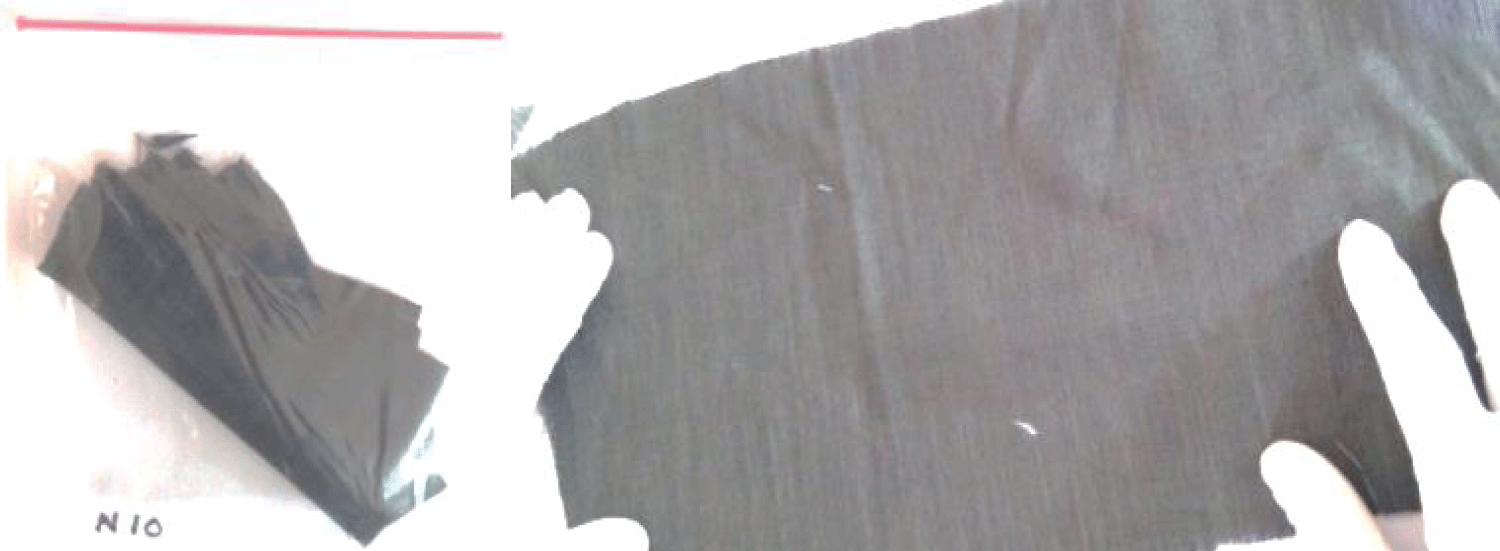
Figure 2: Non-branded Cotton cloth used for study.
Graph 2: Intensity ratio for non-branded cotton fibre.
It is evident from Table 3 indicating Figure 3 data which infers the visual examination of fibre where the sample has a plain weaving pattern and is not twisted with 51 warps and 82 wefts in a 2 cm area of the sample.
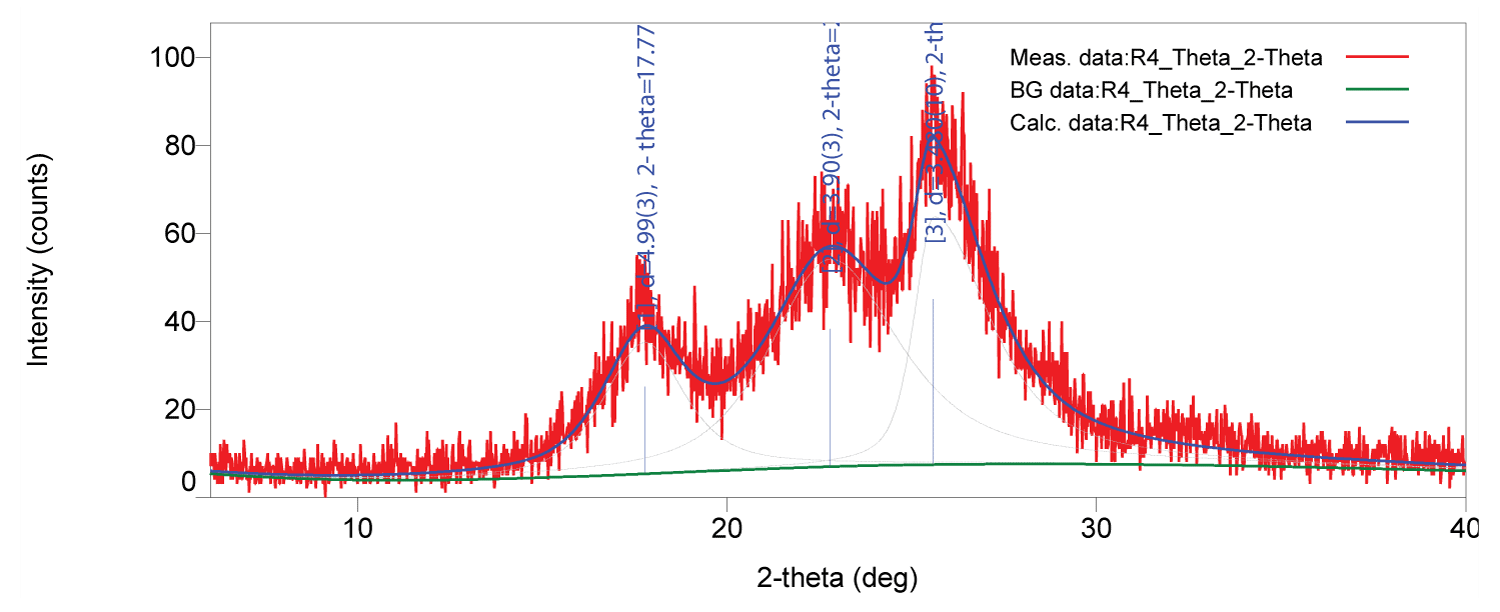
Graph 3 clearly interprets that the branded Polyester textile fibre of both sides coloured the 2θ1 value is 17.7655 and the 2θ2 value is 22.7909 and the 2θ3 value is 25.58 the d[1] value is 4.98853 and the d[2] value is 3.89865 and the d[3] value is 3.47955 at the size (ang) 32.16, 20.38 and 34.88 respectively. The 2θ value indicates the level of atomic numbers of cotton fibre used for the textile and the diffraction will vary according to the level of atomic number and the diffraction may increase or decrease accordingly.
| Table 3: Visual Examination of Branded Polyester Fibre. | |||||||
| Sample | Textile of | Weaving pattern | Colour on side | Twist | Number of yarns in a thread | Number of yarns in fabric(2 cm) | |
| Warp | Weft | ||||||
| Polyester | Shirt | Plain | Both side | Not twisted | Individual fibres | 51 | 82 |
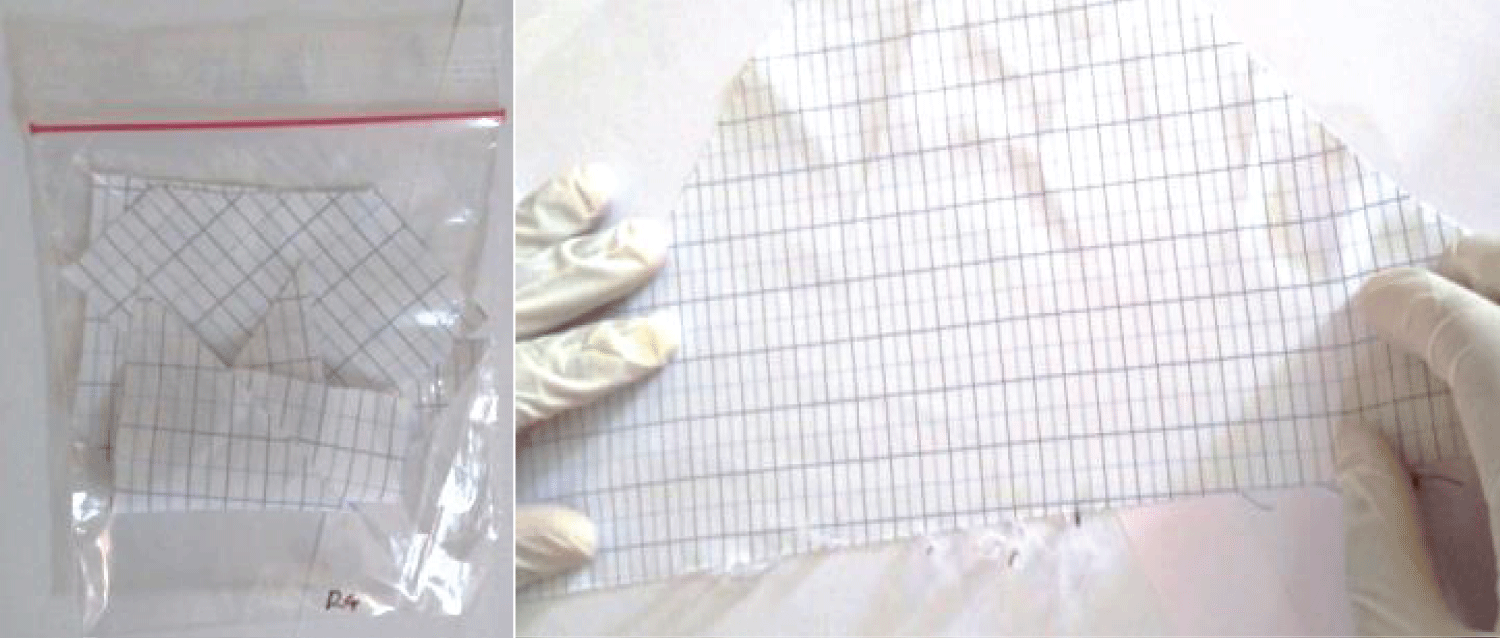
Figure 3: Branded Polyester cloth used for study.
Graph 3: Intensity ratio for branded polyester fibre.
Table 4 reveals data from the sample in Figure 4 which interprets the visual examination of fibre where the sample has a plain weaving pattern and is twisted with 44 warps and 82 wefts in a 2 cm area of the sample.
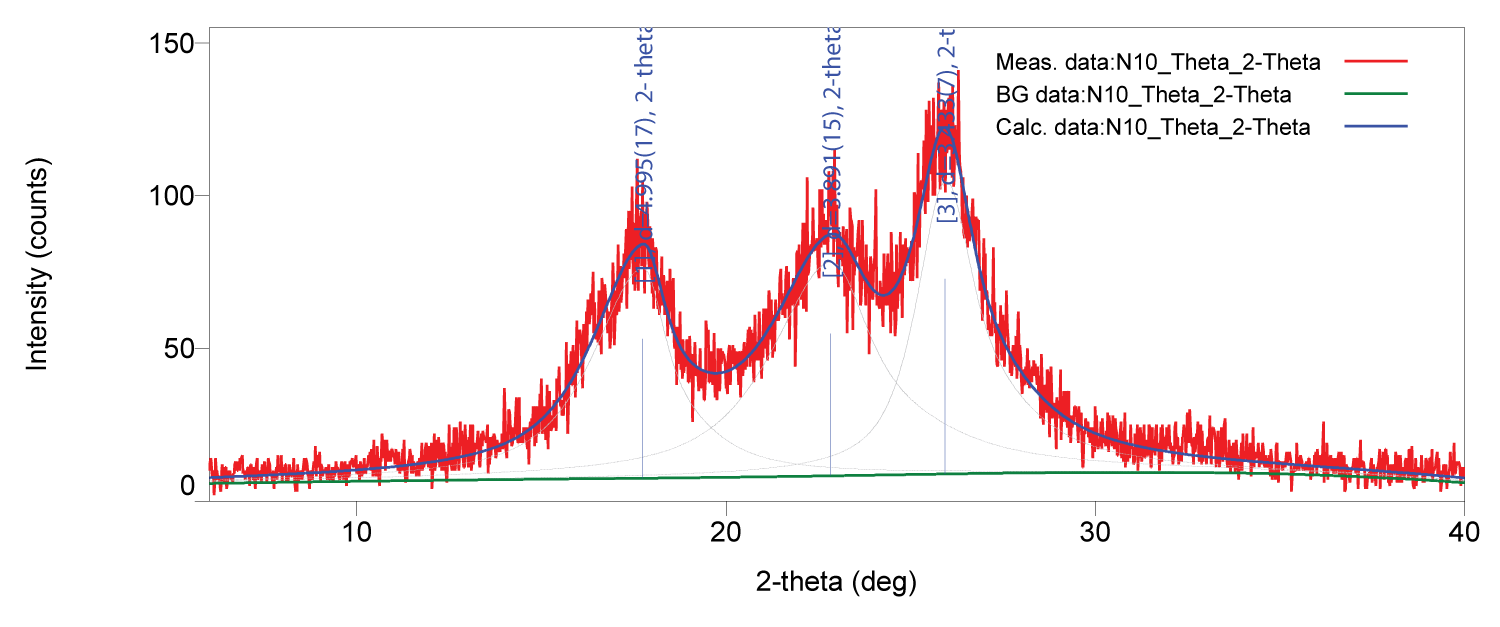
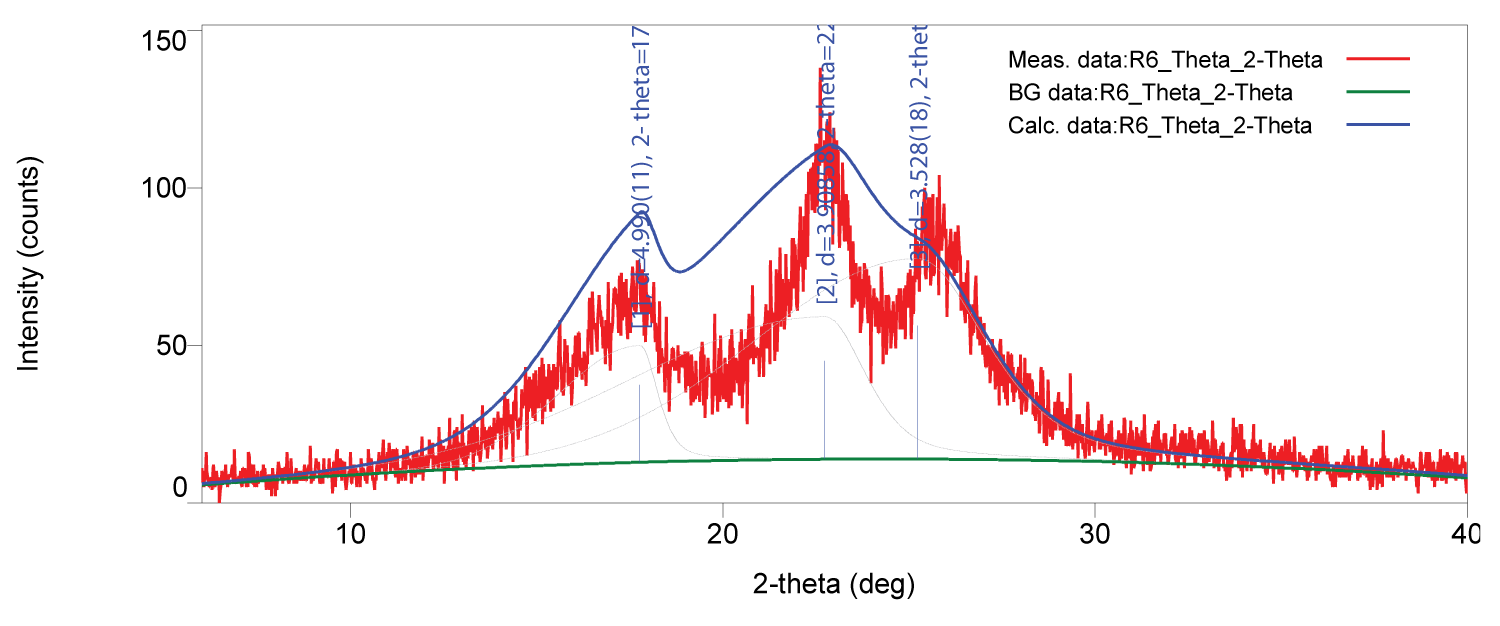
Graph 4 it is very clear that the branded cotton textile fibre of both sides coloured the 2θ1 value is 17.7614 and the 2θ2 value is 25.2236 and the d[1] value is 4.98969 and the d[2] value is 3.52789 at the size (ang) 26.75 and 11.77 respectively. The 2θ value indicates the level of atomic numbers of cotton fibre used for the textile and the diffraction will vary according to the level of atomic number and the diffraction may increase or decrease accordingly.
| Table 4: Visual Examination of Branded Cotton Fibre. | |||||||
| Sample | Textile of | Weaving pattern | Colour on side | Twist | Number of yarns in a thread | Number of yarns in fabric(2 cm) | |
| Warp | Weft | ||||||
| Cotton | Shirt | Plain | Both side | Twisted | Individual fibres | 44 | 82 |
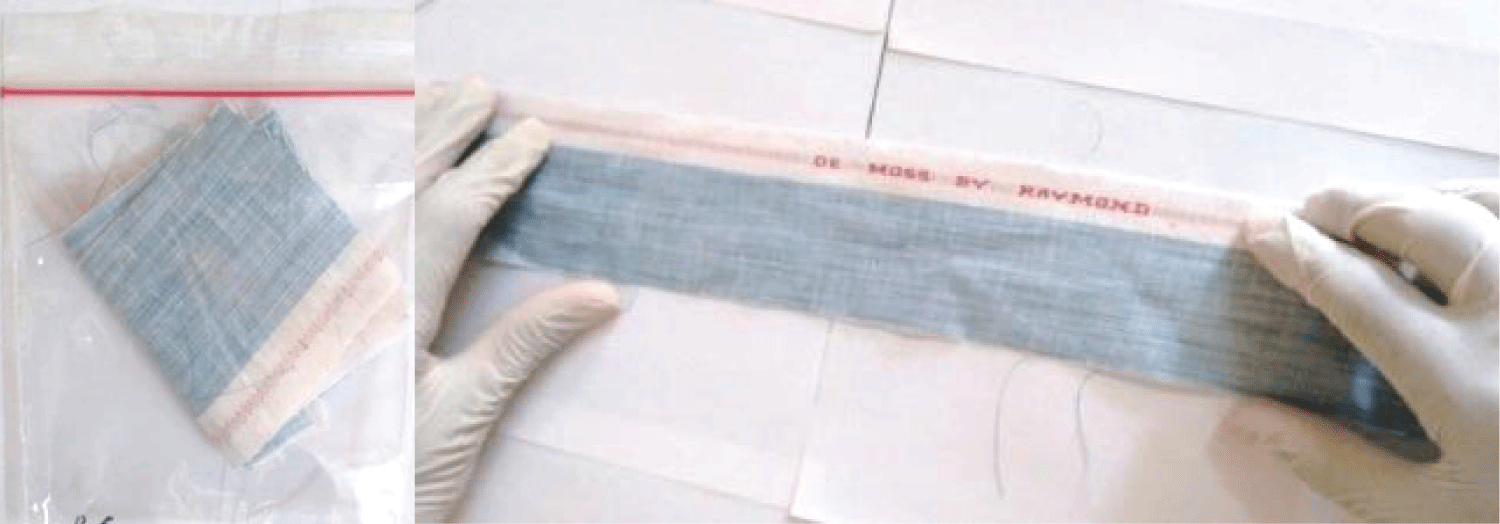
Figure 4: Branded cotton cloth used for study.
Graph 4: Intensity ratio for branded cotton fibre.
Polyester fibre
While looking at the Graphs 1 & 3 i.e. polyester clearly indicates the intensity for non-branded fibre 3 peaks values have been found in which the 2nd peak has the highest value whereas, in branded fibre 3 peaks have been noticed where the 3rd peak has the highest value. Though the sample is of similar polyester fibre, branded and non-branded samples have shown a difference in their crystalline morphology and it is evident [20] that individualised polyester fibre using x-ray fluorescence technique for fibre will have different intensity ratios and has been detected in fibres used for analysis and by this we can differentiate the fibre sample between non-branded and branded fibre. The identified differences in intensity ratios can be attributed to several factors, including variations in manufacturing processes, crystalline morphology, impurities, and trace elements present in the fibers. The manufacturing process itself can introduce unique characteristics to the fibers, influencing their crystal structure and subsequently affecting the XRD patterns. Additionally, impurities and trace elements may contribute to the observed distinctions, further highlighting the sensitivity of XRD analysis in detecting subtle variations in fiber composition.
Cotton fibre
It is evident from Graphs 2 & 4 i.e. cotton that intensity for both the non-branded and branded fibre 3 peaks have been noticed whereas, the placement of the highest peak is not similar in the case of non-branded fibre 3 where the peak has the highest value whereas, in case of branded fibre 2 peak has the highest value. The graph clearly defines the crystalline morphology for cotton as different among the two samples the result is supported by the findings [21] study on the crystalline morphology of cotton, which supports the idea that different cotton samples used for fiber preparation can exhibit diverse peak patterns in XRD analysis. This suggests that the crystalline morphology of cotton is influenced by factors such as the specific type of cotton, processing methods, and inherent impurities. The placement of peaks and their relative intensities can serve as distinctive markers for identifying and characterizing cotton fibers. The findings from the XRD analysis not only contribute to the understanding of the unique crystalline features of cotton fibers but also highlight the potential of crystalline morphology as a valuable tool for fiber identification. When coupled with information about cloth processing methods, impurities, and other relevant factors, XRD can play a crucial role in differentiating between various types of cotton fibers. This has implications for quality control in the textile industry, forensic analysis, and other applications where precise identification of fiber types is essential.
For the purpose of the study, limited samples like 2 types of fibers i.e. cotton and polyester selected from branded and nonbranded manufacturing companies. The decision to fix the maxima based on the type of fiber used for analysis is a practical consideration and is often necessary in research studies. It allows for the optimization of experimental parameters for each type of material, potentially enhancing the accuracy and specificity of the results.
Replication of samples is a valuable practice in research to ensure the reliability and robustness of findings but the result might vary due to the sample size which is in major limitation of the study but, still the results provide valuable insights into the feasibility and potential applications of XRD for differentiating between cotton and polyester fibers from branded and non-branded sources. The study-focused approach on a limited set of samples is a reasonable strategy for an initial investigation. The results, even with limited replication, still provide valuable insights into the feasibility and potential applications of XRD for differentiating between cotton and polyester fibers from branded and non-branded sources.
The study also paved the way for extensive research on fiber on a more diverse range of cloth fibers for analysis of both fresh cloth as well as used cloths for comparison by applying more analytical techniques like FTIR, Raman Spectroscopy, etc.
Overall discussion it is very clear that the samples taken for the study very clearly indicate the difference in the non-branded and branded cloth fibre and it is helpful in the identification of the cloth piece from the scene of a crime, these values might differ according to products. This study is to understand the very nature of cloth polymer crystalline morphology and its nature in the identification of cloth or fibre and to analyse with the alike sample and to identify the culprit.
Cloth is the identity of culture and civilization as society develops the need for clothing also develops so, the need for more and more fibres is required. The result of such demand is rayon, nylon, polyester, etc., which are developed and brought in for use. The cloth not only describes the development of human beings but nowadays it also reveals the truth about a person involved in unlawful activities. Hence, the present study is an attempt to understand whether the cloth or fibre available at a crime scene can be identified and individualized and later be compared with the evidence and prove the relationship between culprit and crime. The study concludes that whether it is non-branded or branded all cloth or fibre is individual and can be analysed and identified with the respective type when there is a need for individualizing based on the polymer’s crystalline morphology used and the process involved in manufacturing the end product.
- Farah S, Kunduru KR, Tsach T, Bentolila A, Domb AJ. Forensic comparison of synthetic fibers. Polymers for Advanced Technologies. 2015; 26(7): 785–796. https://doi.org/10.1002/pat.3540
- Aljannahi A, Alblooshi RA, Alremeithi RH, Karamitsos I, Ahli NA, Askar AM, Albastaki IM, Ahli MM, Modak S. Forensic Analysis of Textile Synthetic Fibers Using a FT-IR Spectroscopy Approach. Molecules. 2022 Jul 3;27(13):4281. doi: 10.3390/molecules27134281. PMID: 35807525; PMCID: PMC9268719.
- Powell R, Collins P, Horsley G, Coumbaros J, van Bronswijk W. Enhancing the evidential value of textile fibres Part 2: Application of a database-driven fibre comparison strategy to a cold-case investigation. Forensic Sci Int. 2021 Aug;325:110894. doi: 10.1016/j.forsciint.2021.110894. Epub 2021 Jul 2. PMID: 34271326.
- Meleiro PP, García-Ruiz C. Spectroscopic techniques for the forensic analysis of textile fibers. Applied Spectroscopy Reviews. 2016; 51(4): 278–301. https://doi.org/10.1080/05704928.2015.1132720
- Mujumdar N, Campiglia AD. CHAPTER 7. A Review on Analytical Techniques Used for Forensic Fiber Analysis. In G Miolo, JL Stair, M Zloh (Eds.), Comprehensive Series in Photochemical & Photobiological Sciences. Royal Society of Chemistry. 2018; 175-206. https://doi.org/10.1039/9781788010344-00175
- Peets, P., Kaupmees, K., Vahur, S., & Leito, I. (2019). Reflectance FT-IR spectroscopy as a viable option for textile fiber identification. Heritage Science, 7(1), 93. https://doi.org/10.1186/s40494-019-0337-z
- Peets, P., Leito, I., Pelt, J., & Vahur, S. (2017). Identification and classification of textile fibres using ATR-FT-IR spectroscopy with chemometric methods. Spectrochimica Acta Part A: Molecular and Biomolecular Spectroscopy, 173, 175–181. https://doi.org/10.1016/j.saa.2016.09.007
- Zapata, F., Ortega-Ojeda, F. E., & García-Ruiz, C. (2022). Forensic examination of textile fibres using Raman imaging and multivariate analysis. Spectrochimica Acta Part A: Molecular and Biomolecular Spectroscopy, 268, 120695. https://doi.org/10.1016/j.saa.2021.120695
- Wang C, Wang N, Liu S, Simth LLP, Zhang H, Zhi Z. Investigation of Microfibril Angle of Flax Fibers Using X-Ray Diffraction and Scanning Electron Microscopy. Journal of Natural Fibers. 2020; 17(7): 1001-1010. https://doi.org/10.1080/15440478.2018.1546639
- Schotman TG, Xu X, Rodewijk N, van der Weerd J. Application of dye analysis in forensic fibre and textile examination: Case examples. Forensic Sci Int. 2017 Sep;278:338-350. doi: 10.1016/j.forsciint.2017.07.026. Epub 2017 Jul 31. PMID: 28802950.
- Goodpaster JV, Liszewski EA. Forensic analysis of dyed textile fibers. Anal Bioanal Chem. 2009 Aug;394(8):2009-18. doi: 10.1007/s00216-009-2885-7. Epub 2009 Jun 20. PMID: 19543886.
- Śmigiel-Kamińska D, Pośpiech J, Makowska J, Stepnowski P, Wąs-Gubała J, Kumirska J. The Identification of Polyester Fibers Dyed with Disperse Dyes for Forensic Purposes. Molecules. 2019 Feb 10;24(3):613. doi: 10.3390/molecules24030613. PMID: 30744148; PMCID: PMC6384617.
- Śmigiel-Kamińska D, Wąs-Gubała J, Stepnowski P, Kumirska J. The Identification of Cotton Fibers Dyed with Reactive Dyes for Forensic Purposes. Molecules. 2020 Nov 20;25(22):5435. doi: 10.3390/molecules25225435. PMID: 33233593; PMCID: PMC7699748.
- Liang J, Frazier J, Benefield V, Chong NS, Zhang M. Forensic Fiber Analysis by Thermal Desorption/Pyrolysis-Direct Analysis in Real Time-Mass Spectrometry. Anal Chem. 2020 Jan 21;92(2):1925-1933. doi: 10.1021/acs.analchem.9b04167. Epub 2019 Dec 31. PMID: 31846295.
- Lynch BJ, Kerrigan GC. Identification of single fibres by X‐ray diffraction in forensic analysis. X-Ray Spectrometry. 1981;10(4): 196-197. https://doi.org/10.1002/xrs.1300100411
- Mihajlović RA. The Use of X-ray Diffraction Analysis in Different Forensic Disciplines. In W. E. Lee, R. Gadow, V. Mitic, & N. Obradovic (Eds.), Proceedings of the III Advanced Ceramics and Applications Conference. 2016; 353-359. Atlantis Press. https://doi.org/10.2991/978-94-6239-157-4_24
- Williams GA. Forensic textile damage analysis: Recent advances. Research and Reports in Forensic Medical Science. 2018; 8: 1-8. https://doi.org/10.2147/RRFMS.S166435
- Raven MD, Fitzpatrick RW, Self PG. Trace evidence examination using laboratory and synchrotron X-ray diffraction techniques. Geological Society, London. Special Publications. 2021; 492(1): 165-179. https://doi.org/10.1144/SP492-2019-36
- Galais V, Fleming H, Nic Daéid N, Ménard H. Scientometric analysis of the forensic science literature for fibre as an evidence type: Access and data availability. Forensic Sci Int Synerg. 2022 May 17;5:100269. doi: 10.1016/j.fsisyn.2022.100269. PMID: 35634573; PMCID: PMC9133568.
- Nishiwaki Y, Honda S, Yamato T, Kondo R, Kaneda A, Hayakawa S. Nondestructive Differentiation of Polyester Single White Fibers Using Synchrotron Radiation Microbeam X-ray Fluorescence Spectrometry with Vertical Focusing. J Forensic Sci. 2020 Sep;65(5):1474-1479. doi: 10.1111/1556-4029.14481. Epub 2020 Jun 15. PMID: 32539170.
- Deng X, Ye S, Wan L, Wu J, Sun H, Ni Y, Liu F. Study on Dissolution and Modification of Cotton Fiber in Different Growth Stages. Materials (Basel). 2022 Apr 6;15(7):2685. doi: 10.3390/ma15072685. PMID: 35408020; PMCID: PMC9000360.